

To get 99% modeling quality in MT4, import real tick history covering your full test window and run the Strategy Tester in "Every tick" mode. Then verify the mismatched-chart error count reads zero before you trust a single result.
That's the whole answer, but the details matter. It says nothing about whether your strategy will survive live spreads, requotes, or a broker that fills orders worse than the tester assumes.
- Confirm mismatched-chart errors show zero in the Journal tab.
- Check that tick counts look reasonable for your instrument and date range.
- Verify the imported data actually spans your chosen Start and End dates.
Modeling quality above 99% is achievable only when tick data covers the entire test period — MT4's default one-minute history typically caps out around 90% no matter how carefully you configure the tester.
Key Takeaways
| Point | Details |
|---|---|
| Import real tick data | M1 history alone typically caps modeling quality near 90 percent. |
| Match your live spread | Set commission and spread in the tester to mirror your actual broker account. |
| Verify before trusting results | Confirm zero mismatched-chart errors and correct date-range coverage. |
| Forward-test after backtesting | Run a 30-day forward test since 99% doesn't validate fills or slippage. |
| Use clean, ready-to-import data | Backtestmarket supplies minute-bar and tick-ready datasets formatted for direct MT4/MT5 import. |
Table of Contents
- Steps to Reach 99% Modeling Quality in MT4
- Why Is My MT4 Modeling Quality Low?
- What Does 99% Modeling Quality Actually Mean?
- How Do You Verify a 99% Modeling Quality Result?
- Why Clean Tick Data Matters More Than Perfect Settings
- What the 99% Number Doesn't Tell You
- Get Import-Ready Tick and Minute-Bar Data From Backtestmarket
- Frequently Asked Questions About MT4 Modeling Quality
- Sources
Steps to Reach 99% Modeling Quality in MT4
Getting to 99% isn't a setting you flip.
-
Acquire a tick archive for your instrument and date range. Look for data in a format your platform can actually digest, ideally CSV with timestamp, bid, and ask columns already aligned to the broker's time zone. Gaps in the source file show up later as gaps in your modeling score, so check coverage before you download anything.
-
Convert the ticks into MT4-compatible history. MT4 wants tick and M1 data structured for its Strategy Tester history files, and the symbol name in your file has to match the symbol name in your terminal exactly, including suffixes like ".raw" or "m" some brokers append.
-
Import both M1 and tick files into the correct MT4 directories, then refresh. Open the History Center, select your symbol and timeframe, import the files, and force a refresh so the terminal rebuilds its internal cache instead of serving stale data.
-
Select "Every tick" as your modeling method and match your live account's spread and commission. The every-tick method reconstructs intrabar price movement from the smallest available timeframe, so it leans hardest on complete tick coverage. Running it with mismatched spread settings gives you a clean modeling score attached to unrealistic trade outcomes.
-
Run a short test window first. Test one week before you commit to a full year. It takes thirty seconds and catches a bad import before you've wasted an hour on a full backtest.
Pro Tip: Name your tick files with the exact date range in the filename before importing. Six months from now, when you're troubleshooting a modeling quality drop, you'll thank yourself for not having to guess which file covers which period.
Why Is My MT4 Modeling Quality Low?
Most low scores trace back to one of four culprits, and each one has a specific fix.
Missing or truncated M1 history is the most common cause.
Gaps in the tick archive produce the same effect on a smaller scale. A missing weekend, a broken data feed during a news event, or a provider that skips low-volume overnight sessions all leave holes the tester has to paper over.
Symbol mapping and time-zone mismatches are sneakier. If your imported data says "EURUSD" but your chart is running "EURUSD.raw," MT4 won't connect the two, no matter how complete the file is.
Quick fixes, in order of how often they solve the problem:
- Re-check that M1 history in the History Center actually spans your full test range.
- Re-import ticks and confirm the symbol name matches your terminal exactly.
- Compare your data provider's time zone against your broker's server time.
- Re-run History Center refresh after every import, not just the first one.
What Does 99% Modeling Quality Actually Mean?
Modeling quality measures the share of simulated price bars built from real recorded ticks rather than mathematically reconstructed ones. It is a data-fidelity score, not a strategy-performance score.
The modeling quality calculation documented on MQL5 explains why one-minute bars alone can't produce full intrabar fidelity: without tick-level detail, the tester has to guess at price movement between the open and close of each minute, and that guesswork caps the achievable score.
That's why MT4's default M1-only approach tends to plateau near 90% even with perfectly clean minute data. Closing that last gap requires real tick imports, not better settings.
A perfect modeling score can sit on top of a strategy that falls apart the moment real spreads widen during a news release. Treat the number as a green light on your data, not on your edge.
How Do You Verify a 99% Modeling Quality Result?
- Check the Journal for mismatched-chart errors. A count of zero is the minimum bar for trusting the result, and unmatched-data errors specifically flag gaps that a clean-looking summary can hide.
- Confirm your imported tick dates align with the Start and End dates you set, including time zone. A one-hour offset between your data provider and your broker's server can quietly shift trade timing.
- Match spread and commission settings to your live account. If your broker charges variable spread and you tested at a fixed 1 pip, re-run it with realistic conditions.
- Run a 30-day forward test or walk-forward validation before risking capital. A high modeling score tells you the past data was clean. It says nothing about how the strategy handles conditions it hasn't seen yet.
Pro Tip: Even with zero mismatched-chart errors, spot-check a handful of trade entry timestamps against your raw tick file. It's the only way to catch reconstructed slices that slipped through without triggering an error flag.
Why Clean Tick Data Matters More Than Perfect Settings
You can nail every tester setting and still stall at a mediocre modeling score if the underlying data has holes. That's the part most guides skip: the settings are the easy half of this problem. The data is the hard half.
Backtestmarket builds its historical datasets around that gap. The catalog covers forex, metals, stock indices, bonds, and commodities with clean minute-bar coverage going back to 2014, packaged for direct import into MT4 and MT5 rather than requiring you to reformat raw files yourself.
- Complete M1 coverage across the full history reduces the truncated-data problem that tanks modeling scores in the first place.
- Correctly formatted, symbol-matched files cut down on the mismatched-chart errors that force re-imports.
- Backtestmarket's import guide for MetaTrader walks through the History Center steps so you're not troubleshooting blind.
- Direct access to engineering support means a data question gets answered by someone who built the pipeline, not a support ticket queue.
None of that replaces forward testing. It just means the data itself stops being the reason your backtest fails.
What the 99% Number Doesn't Tell You
It's closer to a permission slip. It tells you your test is allowed to be trusted on the data side, and that's a lower bar than most traders assume.
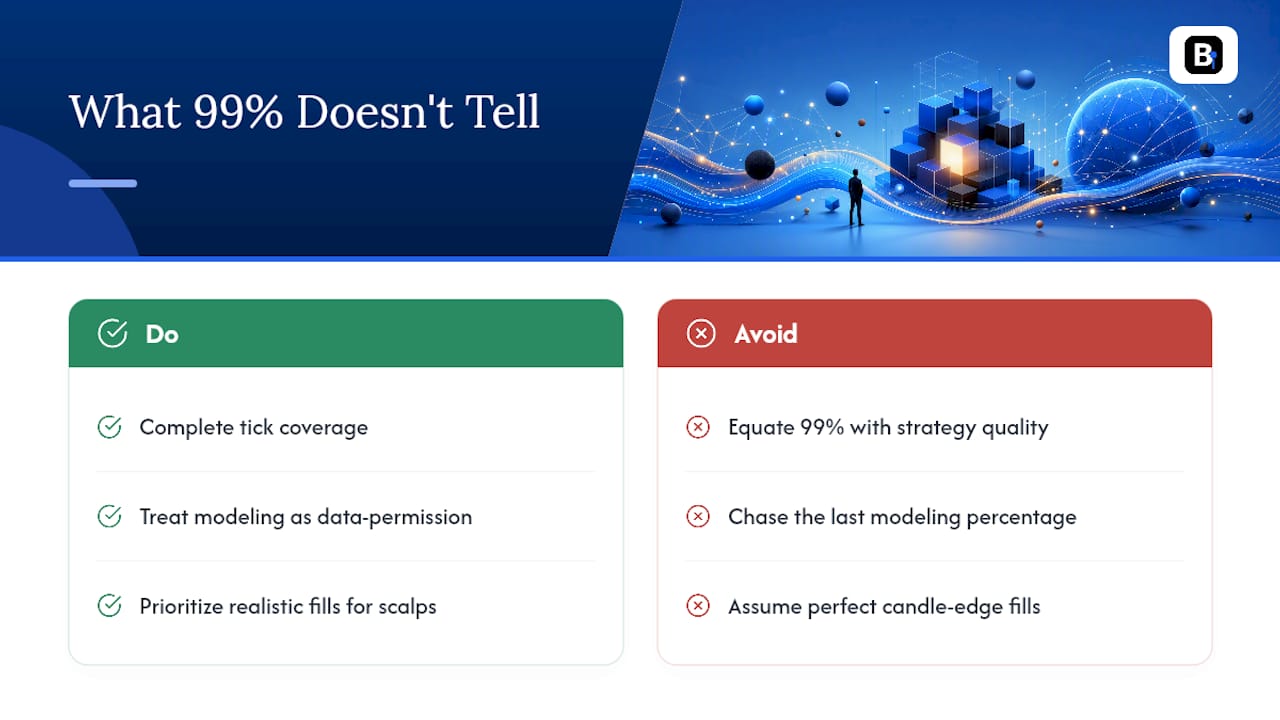
Here's what conventional advice gets wrong: it treats modeling quality as a proxy for strategy quality. Those are two separate questions. A scalping strategy that lives or dies on sub-second fills can hit 99% modeling quality and still lose money live, because MT4 often assumes perfect fills at candle extremes that no real broker delivers during a fast market.
What should come first, before you obsess over the last percentage point of modeling quality? Getting the tick coverage complete enough that gaps aren't randomly distorting your results.
— Start
Get Import-Ready Tick and Minute-Bar Data From Backtestmarket
Every step in this checklist assumes you already have clean, complete data to import, and that's the part most traders underestimate until they're three hours into troubleshooting a mismatched-chart error. Backtestmarket removes that friction by selling ready-to-import datasets instead of raw files you have to reformat and hope work.
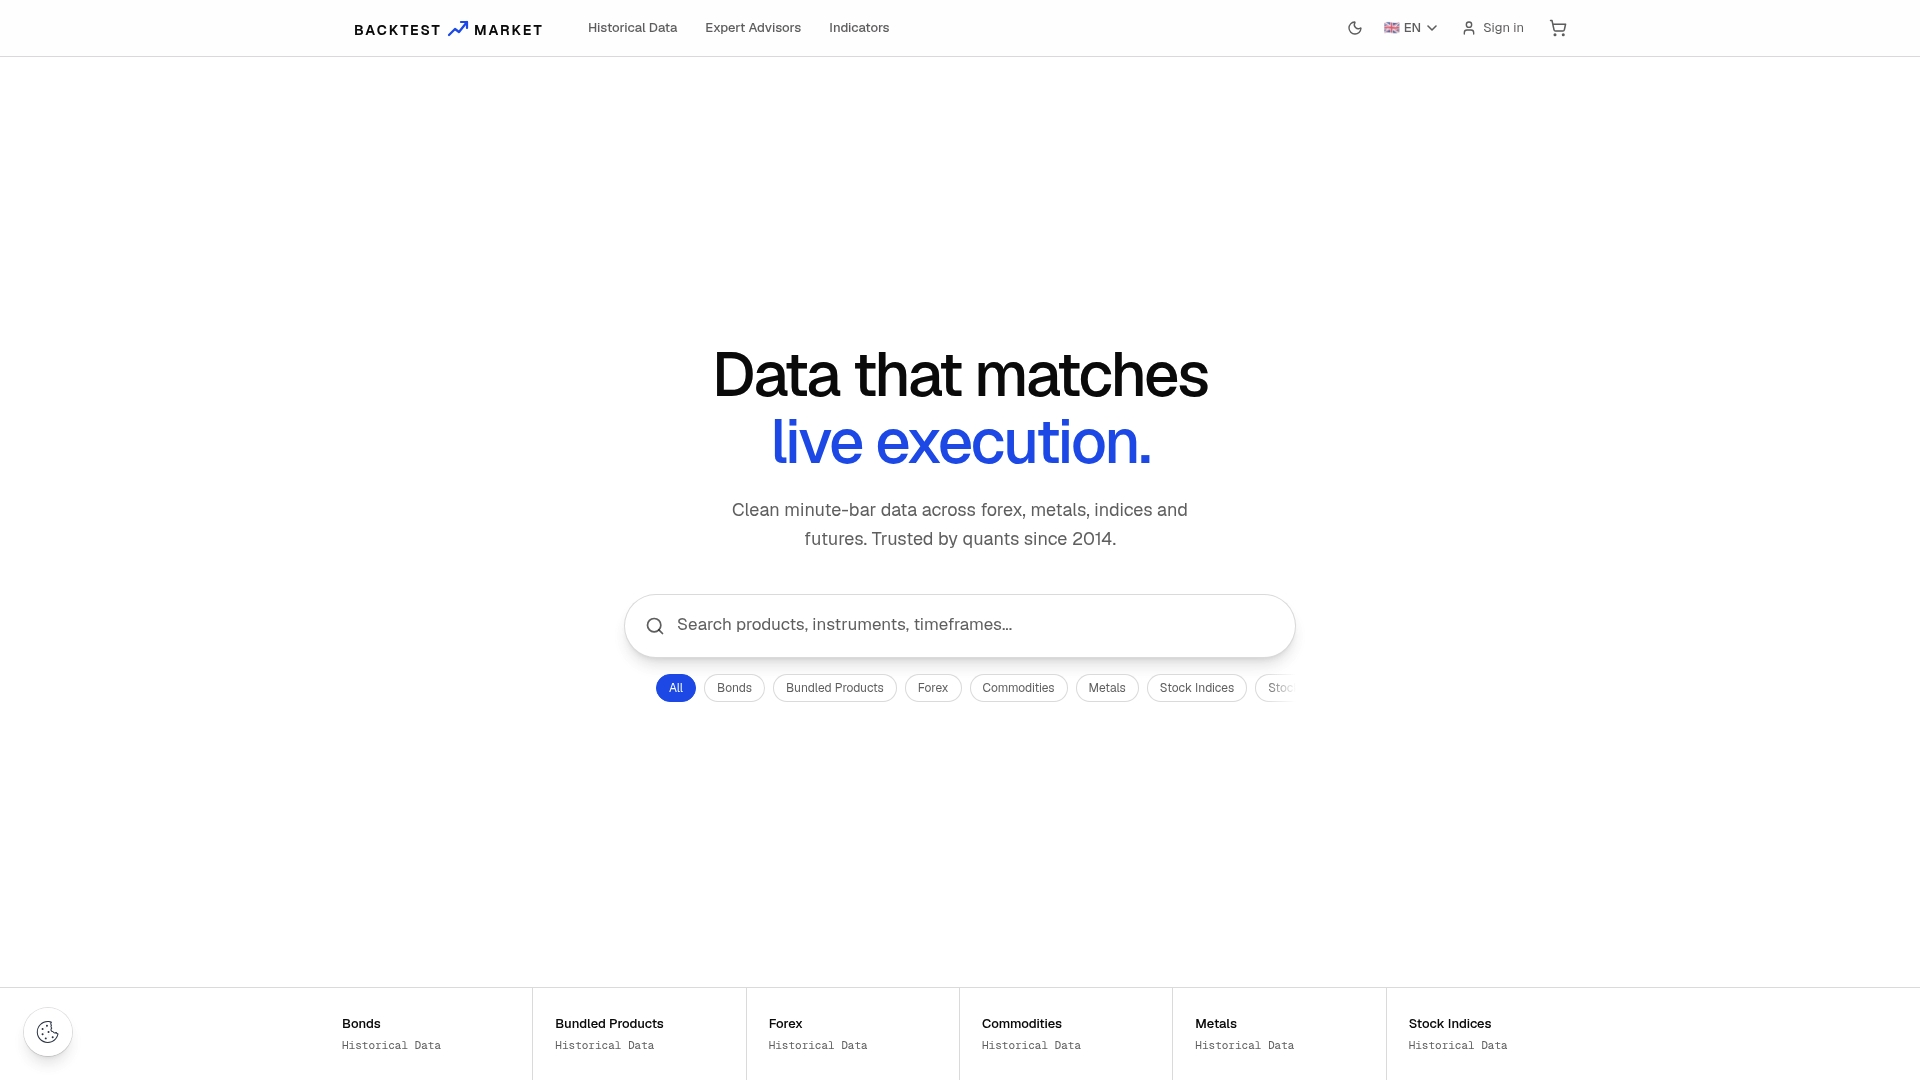
The catalog includes forex pairs bundled by asset class, plus metals, indices, and bonds, all built as one-time downloads with minute-bar coverage going back to 2014. If your test window keeps hitting gaps no matter how carefully you configure the Strategy Tester, the fix usually isn't your settings. It's the source file. Check the forex data bundles against the currency pairs and date range your strategy needs, and you'll have a modeling-quality problem solved before you open the tester again.
Frequently Asked Questions About MT4 Modeling Quality
Not reliably.
No. It confirms your backtest input was high-fidelity. It says nothing about broker fill behavior, slippage, or whether your strategy is curve-fit to one historical period.
That jump is normal. Modeling quality behaves like a step function: once tick and M1 coverage are complete for your test range, the score jumps sharply rather than climbing gradually.
What's a mismatched-chart error and why does it matter?
It's MT4's flag for gaps or inconsistencies in your imported history. A zero count is the minimum requirement before you can trust a high modeling-quality reading.
A 30-day forward test or walk-forward validation is a reasonable starting benchmark before committing real capital, since it exposes execution issues a backtest can't reveal.
Sources
- The 90% Trap: Why Your MT4 Backtests Fail in Live Markets (And How to Fix It) - MT4 Programming
- Every-tick modelling explanation - MQL5 article
- Unmatched data error in MT4 Strategy Tester - EarnForex
Recommended
- Blog | BacktestMarket | BacktestMarket
- Minute Bar Data: What Quants Need for Reliable Backtests | BacktestMarket Blog
- How to Import Data in MetaTrader (MT4 / MT5) | BacktestMarket | BacktestMarket
- Data Snooping Bias: How Researchers and Quants Catch It | BacktestMarket Blog
Related resources
Explore BacktestMarket's Expert Advisor robots to put the ideas in this article into practice.