

A data bundle, in the quant sense, is a packaged set of clean minute-bar OHLCV files with matching metadata, delivered ready to import into a backtesting platform. The main benefit isn't convenience alone. It's that a properly built bundle, like the S&P 500 Pack, saves you the engineering hours of reconstructing bars from raw ticks and gives you a reproducible starting point for strategy testing.
TL;DR:
- Using well-constructed data bundles like the S&P 500 Pack saves hours of reconstruction and ensures reproducibility, but requires verifying coverage, metadata, and checksum validation.
- Confirm timestamps are explicitly stated in exchange local time or UTC and check how daylight saving time transitions are handled to prevent silent shifts in indicators.
- Ensure corporate action adjustments are fully understood, including whether dividends and splits are applied, and verify symbol identifiers stay consistent through renames or relistings.
- Dollar bars often better reflect market activity and provide more stable return distributions than fixed-minute bars, making them preferable for research requiring activity-based sampling.
- Always validate purchase quality by running checksum tests, checking coverages around corporate actions, and confirming folder structures match platform expectations before importing into backtesting systems.
Table of Contents
- What's Actually Inside a Data Bundle
- The Four Technical Pillars You Have to Audit
- Why Bar Construction Method Changes Your Results
- Getting a Bundle Into Your Backtest Pipeline
- The S&P 500 Pack as a Working Example
- Buy the Bundle or Reconstruct From Ticks?
- Get Clean S&P 500 Minute Data Without the Rebuild Work
- Sources
- FAQ
What's Actually Inside a Data Bundle
Open a well-built bundle and you'll find more than a folder of CSVs. A typical package includes per-symbol minute OHLCV files, a compressed archive for the full download, a manifest or README describing coverage dates and known gaps, and checksums so you can confirm nothing got corrupted in transit.
The metadata matters as much as the price data. Each file should specify:
- Timezone: exchange time, UTC, or both, stated explicitly rather than assumed
- Session definitions: regular trading hours versus extended sessions, and how holidays are handled
- Symbol identifiers: ticker plus a stable ID that survives renames or relistings
- Coverage and sampling rules: start date, end date, and whether bars are generated only when trades occur or on a fixed clock
"MT4/MT5-ready" delivery should mean a folder structure that mirrors what MetaTrader expects for history files, with symbol names matching your broker's naming convention and a short import note covering any renaming steps. If a vendor just hands you a zip of loose CSVs with no documentation, that's not a bundle. That's a data dump with a price tag.
The Four Technical Pillars You Have to Audit
Most backtest-to-live mismatches trace back to one of four things, and all four show up before you've written a single line of strategy code. Aggregation loss, time standard mismatches, corporate action inconsistencies, and static precomputed bars are the documented culprits behind most divergence between simulated and live results.
Check these in order before you build anything on top of a purchased dataset:
- Timestamp convention. Confirm whether bars are stamped in exchange local time or UTC, and whether Daylight Saving Time transitions are handled explicitly or are silently ignored. A bundle without a stated timezone field is a guessing game every March and November.
- Corporate action adjustments. Find out exactly what's adjusted (splits, dividends, both) and whether raw and adjusted series are both available. Unadjusted gaps that look like price shocks will wreck a naive strategy's risk metrics.
- Identifier mapping. Verify that symbol IDs stay stable through renames, delistings, and index reshuffles, and that there's a clear mapping back to exchange-level identifiers.
- Revision policy. Ask whether historical bars are immutable once published or get corrected later, and how those corrections reach you. A dataset that quietly rewrites history breaks reproducibility even when nothing else changes.
Pro Tip: Pick three known corporate-action dates for your symbol set (a split, an index rebalance, a dividend) and manually check the bars around them before you trust the whole file. It takes ten minutes and catches most bad vendors immediately.
Run a checksum validation on arrival too. It's the fastest way to know the file wasn't truncated or altered somewhere between the server and your disk.
Why Bar Construction Method Changes Your Results
A minute bar samples the market on a fixed clock: one bar every sixty seconds, regardless of how much or how little trading happened inside that window. Volume bars, dollar bars, tick bars, and other information-driven alternatives sample based on market activity instead, closing a bar once a threshold of volume, dollar turnover, or trade count is hit.
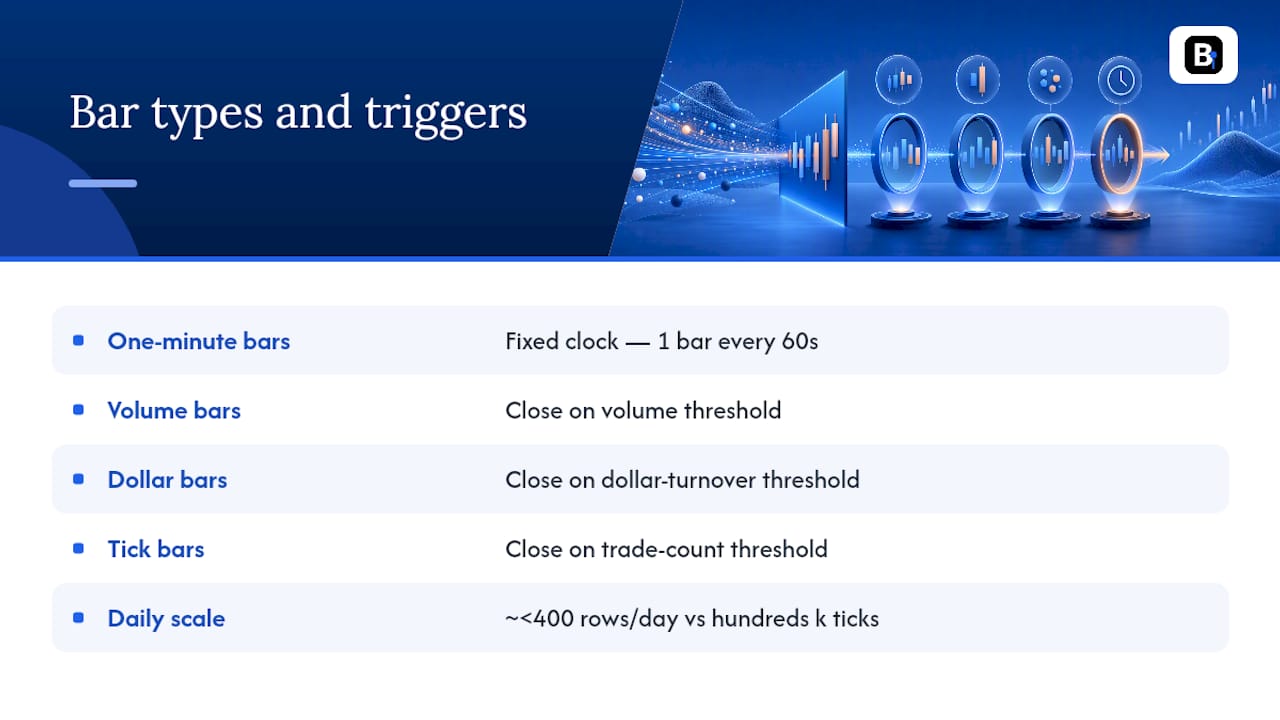
That difference isn't cosmetic. Information-driven bars tend to produce return distributions closer to normal and more stable variance than fixed-time bars, which cluster activity unevenly across the trading day. Dollar bars in particular are often the safer default for research, since they self-adjust for price-level changes and need less retuning after a split.
So when are minute bars enough? For most swing and intraday strategies that don't depend on microsecond-level order flow, clean minute bars are perfectly adequate, and they're dramatically cheaper to store and process. A day of one-minute bars runs under 400 rows per symbol, while the underlying tick stream for the same day can hit hundreds of thousands of events. Reserve tick reconstruction, or a proper volume/dollar bar pipeline, for microstructure research or strategies sensitive to intraday activity bursts, and remember that rolling-window indicators calculated on minute bars will behave differently near open and close than the same indicators built from activity-sampled bars.
Getting a Bundle Into Your Backtest Pipeline
Buying clean data is only half the job. How you import and version it determines whether your results hold up six months from now when you rerun the same test.
- Verify before you touch anything. Run the checksum, read the manifest, and pull a random week of bars to sanity-check the timeline for gaps or duplicate timestamps.
- Confirm the timezone and session mapping against what your platform expects. This is the single most common source of silently shifted indicators.
- Import using the documented folder structure and symbol names. MT4 and MT5 both expect specific file naming and history folder conventions, and mismatches here cause "empty bar" errors that look like data problems but aren't.
- Version the raw download itself, not just your processed output, and log every preprocessing step (resampling, gap filling, adjustment choices) so the pipeline is reproducible months later.
Pro Tip: If an indicator looks time-shifted after import, check the DST handling first. It's the most common cause, and far more common than an actual data error. A dedicated walkthrough on importing historical data into MT4 and MT5 covers the folder and naming pitfalls in more detail, and a deeper look at fixing DST errors in minute data is worth bookmarking if you work across multiple exchange time zones.
The S&P 500 Pack as a Working Example
A provider has delivered clean intraday datasets since 2014, and the S&P 500 Pack is a straightforward case study in what a properly assembled bundle should contain. It's the kind of concrete inventory worth checking item by item against the four pillars above.
- Per-symbol minute OHLCV files covering the index constituents, packaged for direct download
- A manifest documenting coverage dates, symbol identifiers, and known gaps
- Import notes for MT4/MT5-ready delivery, including folder layout and naming conventions
- Access to engineer-backed support for questions on timestamp conventions or adjustment handling
On receipt, run the same checks outlined earlier: confirm the timezone field, spot-check a known corporate-action date for an index constituent, and validate the checksum before loading anything into your platform. That verification step, more than any marketing claim, is what tells you whether a historical intraday dataset is actually backtest-ready or just looks that way on the product page.
Buy the Bundle or Reconstruct From Ticks?
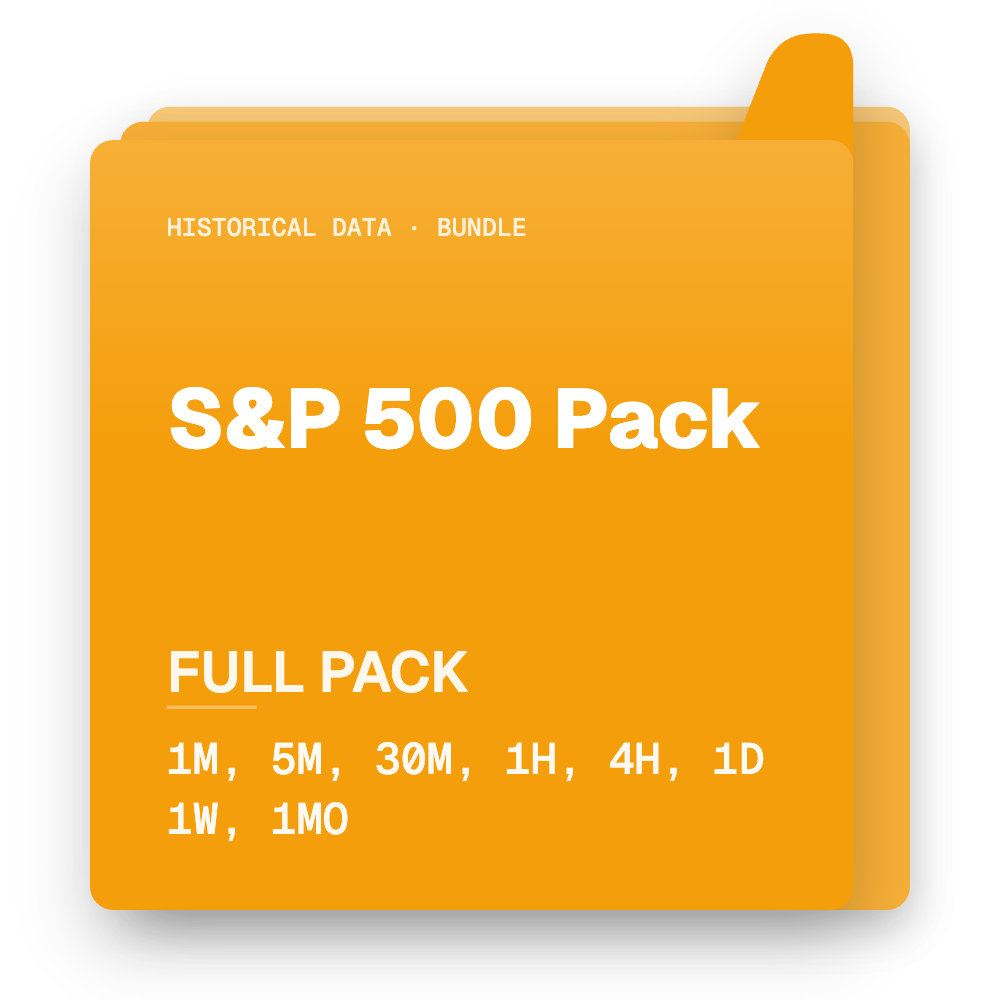
Buying a cleaned minute-bar bundle gets you to a reproducible benchmark fast, and that speed has real value when you're prototyping across dozens of symbols. Reconstructing from raw ticks gives you the highest fidelity, but at a real storage and engineering cost that most projects don't need everywhere at once.
The practical answer is usually both: buy bundles for the bulk of your workflow and reserve tick ingestion for the specific subsamples where microstructure actually drives your edge.
— Start
Get Clean S&P 500 Minute Data Without the Rebuild Work
If you've read this far, you already know the alternative to a good bundle is weeks spent scrubbing raw ticks, fixing DST errors, and second-guessing whether your corporate-action adjustments match reality. The S&P 500 Pack skips that entirely: clean minute-bar files for the index constituents, a manifest you can actually audit, and import notes built for MT4 and MT5.
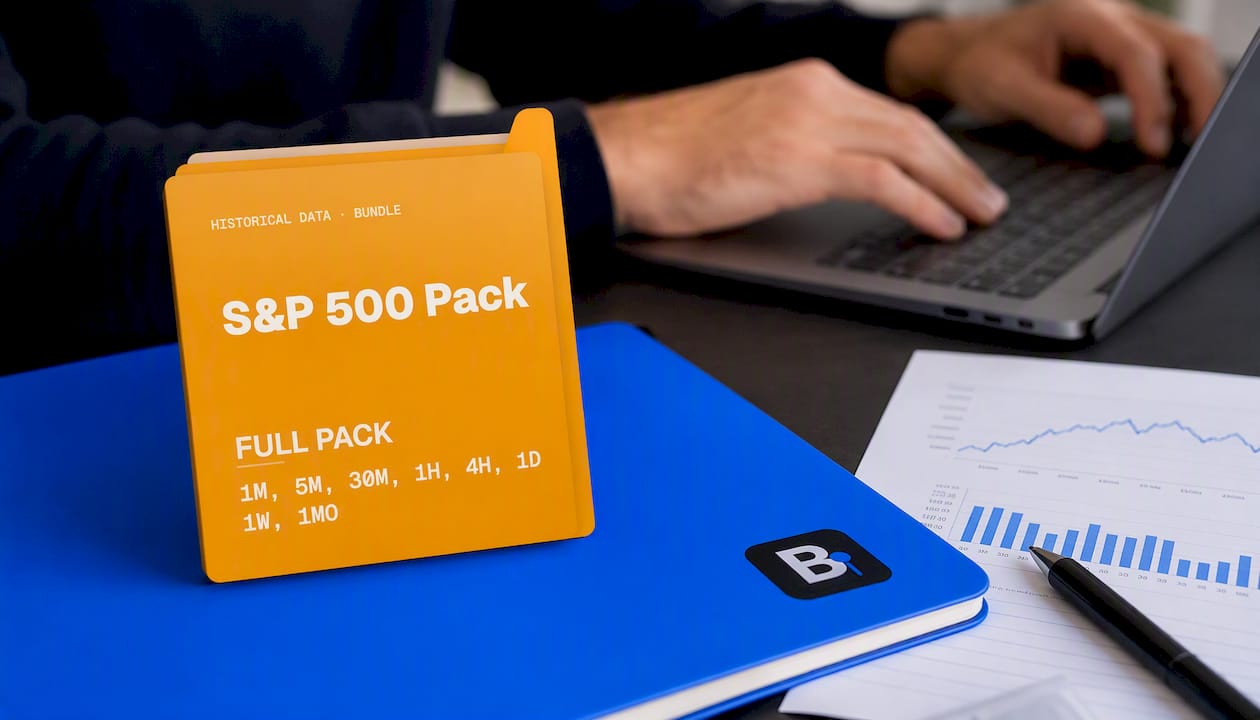
You get the downloadable dataset immediately after purchase, along with direct access to engineer-backed support if a timestamp or adjustment question comes up during import. Head to the S&P 500 Pack page, check the coverage dates against your project's needs, and download the set to run your own verification checks before you build a single backtest on top of it.
Sources
- Bar Aggregation and Resampling Choices, Explained | Quant Memo
- Why Do US Stock Minute Bar Backtests Fail to Match Live Trading Results? - DEV Community
FAQ
What Is a Data Bundle in Quant Trading?
It's a packaged set of clean, minute-bar OHLCV files with metadata (timezone, symbol IDs, coverage dates) delivered ready for import into platforms like MT4 or MT5, such as the S&P 500 Pack.
How Are Data Bundles Different From Raw Tick Data?
Bundles compress the market into fixed-interval OHLCV summaries, typically under 400 rows a day per symbol, while raw tick streams for the same period can run into the hundreds of thousands of events.
Do Minute Bars Cause Backtest and Live Trading Mismatches?
Mismatches usually come from aggregation loss, timestamp convention errors, and inconsistent corporate action adjustments, not from minute bars themselves, and rebuilding bars from ticks is the most reliable fix when it happens.
Should I Use Volume or Dollar Bars Instead of Minute Bars?
Dollar bars are often a safer default for research since they self-adjust for price changes, but minute bars remain adequate for most strategies that don't depend on microstructure-level activity.
What Should I Check Before Trusting a Purchased Data Bundle?
Verify the timestamp convention and DST handling, confirm the corporate action adjustment policy, check identifier stability, and review the revision policy before running a single backtest.
Recommended
- Minute Bar Data: What Quants Need for Reliable Backtests
- 5 Audits Quants Must Run on Outlier Handled M1 Data Before MT4/MT5
Related resources
Explore BacktestMarket's historical data packs to put the ideas in this article into practice.