

Data snooping bias is what happens when the same dataset gets reused, explicitly or quietly, to both generate a hypothesis and test it, producing results that look statistically significant but vanish when checked against fresh data. It shows up under different names depending on who you ask: data dredging, p-hacking, HARKing (hypothesizing after results are known). All of them describe the same core failure. You searched enough haystacks that a needle turned up by chance, then reported the needle as if you'd been looking for it all along.
The practical damage is real. In drug trials, it produces false positives that make it past peer review. In quantitative trading, it produces backtests with gorgeous equity curves that collapse within weeks of going live. Lo and MacKinlay's 1990 paper showed that portfolio sorts built from the same data used to pick the sorting variable can reject the null hypothesis with certainty, even when there's no real effect. That's not a rounding error. That's a coin flip rigged to always land heads.
Three mitigations matter more than any others, and you should apply them before you read another paragraph:
- Hold out real out-of-sample data and never touch it until your model is frozen.
- Enforce point-in-time data discipline so no feature or fill uses information that wasn't actually available at that timestamp.
- Correct for multiple testing with Bonferroni or Benjamini-Hochberg FDR whenever you've run more than a handful of comparisons.
Pro Tip: Run a T+1 shift test on any backtest before trusting it: shift your signals forward one bar and rerun. If performance barely changes, you likely have a look-ahead leak feeding the model information from the future.
Pro Tip: Literally count every comparison you've made, including chart peeks and dropped variables, not just the tests you formally ran. Hidden comparisons still inflate your effective error rate.
Pro Tip: Treat suspiciously smooth equity curves as a red flag, not a reward. Real markets are noisy; a backtest with a near-45-degree equity line is telling you something is leaking, not that you found alpha.
A same-bar fill or an indicator peek can manufacture an annualized Sharpe ratio near +14.79 out of pure noise. If your backtest looks too good, it probably is.
Key Takeaways
Data snooping bias inflates apparent performance by reusing data for both discovery and confirmation, and it is only reliably caught by holdout testing, point-in-time data discipline, and multiple-testing corrections applied honestly against the full count of trials attempted.
| Point | Details |
|---|---|
| Snooping hides in scale | Large searches across thousands of parameters make false positives statistically inevitable, not a sign of carelessness. |
| Look-ahead leaks are severe | A same-bar fill alone can manufacture a Sharpe near +14.79 from pure noise, per a controlled study. |
| Correction choice depends on test count | Use Bonferroni for small, costly-to-miss test batches; use Benjamini-Hochberg FDR for large exploratory sweeps. |
| Reality Check adjusts for the full search | White's 2000 procedure bootstraps the entire candidate universe, not just the winning strategy, to compute a corrected p-value. |
| Point-in-time data prevents leaks structurally | Attaching a knowledge date to every row removes the opportunity for look-ahead bias rather than relying on manual checks. |
Table of Contents
- What Is Data Snooping Bias, and How Does It Differ From Related Terms?
- How Does Data Snooping Actually Happen in a Real Pipeline?
- What Do Snooped Results Look Like in Practice?
- Why Does Naive Statistical Inference Break Down Here?
- What Tests Actually Detect Data Snooping Bias?
- What Corrections Actually Prevent Data Snooping Bias?
- How Should Quant Traders Build a Backtest That Survives Contact With Live Markets?
- A One-Page Checklist Before You Trust Any Result
- What Does a Worked Reality Check Example Actually Show?
- How Should You Report Tests So Others Can Verify Your Work?
- An Editorial Note on Why Snooping Keeps Fooling Smart People
- Frequently Asked Questions About Data Snooping Bias
- Sources
What Is Data Snooping Bias, and How Does It Differ From Related Terms?
Data snooping is the umbrella term: reusing a dataset for both exploration and confirmation, so the "discovery" is partly or wholly an artifact of the data itself rather than a real pattern. Data dredging is the mechanical version of this. Running test after test on the same numbers until one clears a significance threshold, then reporting only that one. A team running 20 independent subgroup analyses at α = 0.05 should expect roughly one false positive by chance alone, which is exactly what data dredging exploits, whether the researcher realizes it or not.
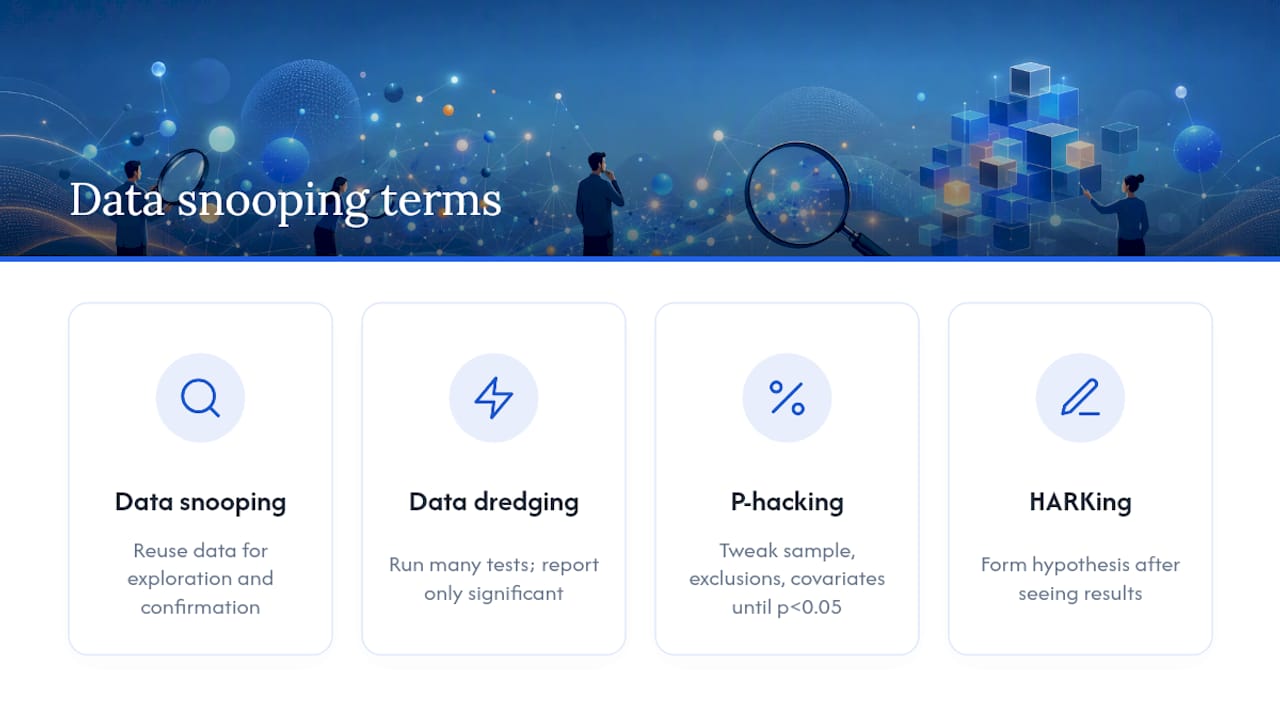
P-hacking is data dredging's cousin focused specifically on p-values: tweaking sample size, exclusion criteria, or covariates until a result crosses 0.05, then stopping. A clinical trial that tests ten endpoints and reports only the two that hit significance is p-hacking in its most common real-world form.
HARKing stands for "hypothesizing after the results are known." You look at your data, spot a pattern, then write the introduction of your paper as if you'd predicted that pattern all along. It's a different failure than data dredging because the statistics might be perfectly clean. The dishonesty is in pretending the hypothesis came first.
Look-ahead bias is time-ordering specific. It occurs when a model, knowingly or not, uses information that would not have been available at the moment a decision was supposedly made. A backtest that fills a trade at the same bar's closing price, using data that wasn't final until after the bar closed, is a textbook example.
These terms overlap constantly with the multiple comparisons problem (running many tests inflates the chance that at least one looks significant) and optional stopping (checking results as data accumulates and stopping the moment they look favorable). Both are mechanisms that produce the snooping effect described above, just triggered differently. A coin flipped 20 times will show a "streak" of five heads in a row more often than intuition suggests, and if you only report the streak, you've dredged your own coin.
How Does Data Snooping Actually Happen in a Real Pipeline?
Snooping rarely announces itself. It creeps in through ordinary-looking research habits that feel like due diligence at the time. Here's the taxonomy that matters most:
- Multiple hypothesis testing. Running dozens of variable combinations, model types, or thresholds, then reporting the best one without adjusting for how many you tried.
- Optional stopping. Checking a result partway through data collection and halting once it looks favorable, rather than fixing the sample size in advance.
- Post-hoc subgrouping. Slicing a dataset by age, sector, or time window after seeing the overall result is weak, hunting for a slice where it looks strong.
- Parameter tuning after inspection. Adjusting a moving-average window or a stop-loss threshold after watching how it performs on the exact data you're about to report results on.
- Reusable holdout misuse. Treating a "held-out" test set as reusable, peeking at it repeatedly across iterations until it stops being a true holdout.
- Look-ahead and data leakage. Letting features, fills, or normalization statistics quietly incorporate future information.
A hidden comparison usually looks like a loop with no audit trail. Picture a for-loop over 50 candidate features, each scored against the full dataset, with only the top three ever mentioned in the writeup. The other 47 comparisons happened. They just don't show up anywhere, and that absence is the problem. The University of Texas's guidance on hidden comparisons makes the point directly: you have to count exploratory visualizations and dropped variables as part of your error budget, not just the tests you formally wrote up.
Pro Tip: Grep your Jupyter notebook history or hyperparameter search logs for every distinct configuration you ever ran, not just the ones in your final script. That number, not the number in your paper, is your real multiple comparisons count.
Spotting cues differ by mechanism. Optional stopping shows up as datasets with suspiciously round sample sizes that don't match a pre-specified design. Post-hoc subgrouping shows up as a paper that mentions subgroup results before mentioning the overall result. Parameter tuning after inspection shows up in version control history where a hyperparameter file was edited after a results notebook was already run. In finance specifically, look-ahead leakage shows up as backtests where performance is suspiciously stable across every regime, bull, bear, and sideways alike, because a real strategy usually struggles somewhere.
What Do Snooped Results Look Like in Practice?
Pharmaceutical trials are the classic case. A drug trial tests ten clinical endpoints (survival, symptom scores, biomarkers, quality-of-life measures) and only two hit statistical significance. If the paper reports those two as the primary findings without disclosing the other eight, the "significant" result is likely a false positive dressed up as a discovery. This exact pattern has driven multiple retracted or non-replicated trials over the decades and is a major reason regulatory bodies now push for pre-registered primary endpoints.
The coin-flip illustration makes the mechanism unmistakable. Flip a fair coin 20 times per sequence, generate 100 sequences, and at least a few will show six or seven heads in a row. If you only publish the streak-heavy sequence and claim you found a "biased coin," you've dredged your own noise into a discovery. Scale that up to a hedge fund testing 500 trading signals against the same five years of price data, and pure chance guarantees several signals will look profitable, regardless of whether any of them carry real predictive power.
Quantitative trading provides the sharpest illustration because the consequences are financial rather than academic. A backtest that fills orders at the same bar's close using data not finalized until after that bar, or that references an indicator computed with a slight peek forward, can inflate an annualized Sharpe ratio by more than +14 points from pure noise. A controlled study isolating individual leak types found a same-bar fill alone manufactured a Sharpe near +14.79, while an indicator peek added roughly +4.76, even when the underlying strategy was fed pure noise with no real signal at all.

Snooped strategies fail in a recognizable way once deployed. Performance doesn't degrade gradually. It falls off a cliff within the first few weeks, because the live market never had the future information the backtest was secretly using. A second tell: the strategy works beautifully in one market regime and inexplicably falls apart the moment volatility shifts, because the "edge" was really an artifact of that specific historical window rather than a durable pattern. Independent replication is the final test, and snooped results almost never survive it, because nobody else has access to the exact same accidental leak.
Why Does Naive Statistical Inference Break Down Here?
The mechanism is the multiple comparisons problem, and the math behind it is uncomfortably simple. If you run a single test at α = 0.05, your chance of a false positive under the null hypothesis is 5%. Run 20 independent tests at that same threshold, and the probability that at least one comes back "significant" by pure chance climbs to roughly 1 minus (0.95)^20, which works out to about 64%. Run 100 tests, and a false positive becomes almost a certainty. This is Type I error inflation, and it accumulates every time you reuse a dataset for a new comparison, whether you're aware you're testing something new or not.
Two correction families address this, and they solve different problems:
- Bonferroni correction divides your significance threshold by the number of tests, controlling the family-wise error rate (the probability of even one false positive across the whole batch). It's conservative and simple, and it works well when you have a small number of tests and genuinely need to avoid any false positive.
- Benjamini-Hochberg FDR controls the expected proportion of false positives among everything you call significant, rather than guaranteeing zero false positives across the board. It's less conservative than Bonferroni and scales far better when you're testing hundreds or thousands of hypotheses, which is common in genomics and increasingly common in large-scale factor research.
Choose Bonferroni when a single false positive would be costly and your test count is small. Choose Benjamini-Hochberg FDR when you're running a large exploratory sweep and can tolerate a small, known fraction of false discoveries in exchange for more statistical power.
Pro Tip: When counting your effective number of tests, include every chart you eyeballed, every dropped feature, and every nested hyperparameter combination your grid search touched, not just the models that made it into your final report. Undercounting your tests is the single most common way researchers accidentally understate their own false discovery risk.
What Tests Actually Detect Data Snooping Bias?
Detection comes down to forcing your model to prove itself on data it has genuinely never touched, and doing so in a way that respects time order. Here's a working sequence:
- Strict out-of-sample splits. Partition your data into training, validation, and test sets before any exploration begins, and lock the test set away until the very last step.
- Nested cross-validation. Use an inner loop for hyperparameter tuning and a separate outer loop for performance estimation, so tuning decisions never leak into your accuracy estimate.
- Purged and walk-forward cross-validation for time series. Standard k-fold CV shuffles data randomly, which destroys time order and lets future information bleed into training folds. Purged CV removes samples near the fold boundary; walk-forward CV always trains on the past and tests on a later, non-overlapping window.
- Point-in-time indexing. Every data row carries a knowledge date, not just a period date, so a feature can never accidentally use information that wasn't actually known yet.
White's Reality Check, introduced in 2000, formalizes the detection problem for model selection specifically. The workflow: run your full specification search across every candidate model or rule you tested, record the best-performing one's statistic, then bootstrap resample the entire universe of candidates (not just the winner) to build a null distribution for "what's the best result you'd expect from this many trials, if none of them actually worked?" The Reality Check's corrected p-value tells you whether your best strategy beats that null distribution. It differs from a naive bootstrap because a naive bootstrap only resamples the winning strategy in isolation, ignoring how many other strategies you tried and silently discarded.
Time-series data needs specialized resampling because standard bootstrap assumes independence between observations, which financial returns violate through autocorrelation and volatility clustering. Block bootstrap resamples contiguous chunks of the series to preserve local dependence structure. Stationary bootstrap uses random block lengths to avoid artifacts from a fixed block size. Use either whenever your data shows meaningful autocorrelation, which is most financial time series.
Pro Tip: Run a one-bar (or one-day) shift test on every backtest before you trust it: lag your signal by one period and rerun the full simulation. Performance should degrade meaningfully. If it barely moves, your model is likely using information from the future.
What Corrections Actually Prevent Data Snooping Bias?
Ranked roughly by how much protection they buy you per unit of effort:
- Point-in-time data and timestamp discipline. This is the foundation. If every row carries an accurate knowledge date, look-ahead leakage becomes structurally impossible rather than something you have to remember to check for.
- True holdouts and out-of-sample testing. Lock a test set away before you start exploring, and treat any peek at it as consuming your one shot.
- Pre-registration or a written analysis plan. Committing to your hypothesis and analysis method before seeing results eliminates HARKing by construction. Registered reports materially reduce post-hoc selection because the hypothesis is locked and reviewed before the data is even collected.
- Multiple-testing corrections. Bonferroni or Benjamini-Hochberg FDR, applied honestly against your full, counted test universe.
- Resampling-based tests like the Reality Check. Especially valuable when you've run a large specification search and need a defensible corrected p-value rather than a raw best-in-class statistic.
- Conservative, deflated reporting. When in doubt, report a deflated Sharpe ratio or a shrinkage-adjusted estimate rather than the raw number your best-performing variant produced.
Small-N confirmatory studies (a single clinical trial, a handful of A/B tests) lean hardest on pre-registration and Bonferroni, since the test count is countable and the cost of a false positive is high. Large-N exploratory searches (factor mining across thousands of tickers, genome-wide association studies) lean on Benjamini-Hochberg FDR and Reality Check style resampling, since Bonferroni would be so conservative it kills almost all statistical power.
Workflow matters as much as the statistics. Immutable experiment logs that record every model configuration you ever ran, not just the survivors, turn "how many tests did I run" from a guess into a query. Automatic test counting, built into your experiment tracker, keeps your correction honest even when you lose track manually. Seeded, randomized search protocols prevent you from unconsciously nudging a random search toward a result you already suspect. Reproducible notebooks, ones a colleague could rerun end-to-end and get your exact numbers, are the cheapest insurance policy against snooping you'll ever buy.
Pro Tip: Build the shift test into your backtesting pipeline as a mandatory, automated step, not a manual sanity check you run "when you remember." The strategies most likely to fail a shift test are exactly the ones nobody thought to run it on.
Read Backtestmarket's blog for hands-on notes on holdout design and rolling validation if you want implementation detail beyond the checklist above.
How Should Quant Traders Build a Backtest That Survives Contact With Live Markets?
The recipe below assumes you're working with historical price data and want a backtest that means something once real capital is on the line.
- Construct point-in-time data first. Every price, fundamental figure, and corporate action needs a knowledge date, not just a period date. Reconstructed index membership and delisted-stock handling matter here; a backtest that quietly excludes companies that went bankrupt is inflating its own returns by survivorship.
- Define realistic execution assumptions before you see performance. Slippage, spread, and latency should be set based on the instrument's actual liquidity profile, not tuned afterward to make the equity curve look smoother.
- Build training, validation, and test splits with purging and embargoing. Leave a gap between your training window and your test window so that any autocorrelation in your labels can't leak information across the boundary.
- Run a T+1 shift check on the finished model. If shifting every signal forward one bar doesn't meaningfully hurt performance, something is leaking.
- Apply Reality Check or block-bootstrapped tests across every strategy variation you tried, not just the winner, before reporting a final number.
A few data-prep details separate a real backtest from a leaking one: knowledge date versus period date for every fundamental figure, reconstructed index membership rather than today's constituent list applied retroactively, explicit delisting handling, and correct timing for corporate actions like splits and dividend adjustments. Standard practice for quarterly fundamentals uses a 60 to 90 day lag to reflect real reporting delays, with 90 to 180 days as the conservative default for annual figures. Corrected backtests using these lags typically show lower, more believable returns than their uncorrected counterparts. That drop in performance is typically the bias leaving the system, not necessarily a sign of an error.
- Use a realistic fills and slippage model calibrated to the instrument's actual bid-ask spread and typical volume, not a flat assumption borrowed from a different asset class.
- Impose liquidity constraints so a strategy can't theoretically trade size the real market couldn't have absorbed.
- Stress-test across at least two distinct volatility regimes; a strategy that only works in one is telling you something about where its edge actually comes from.
Clean, accurately time-aligned minute-bar data removes an entire category of leak before you even start modeling, since a large share of look-ahead problems trace back to poorly reconstructed or improperly timestamped historical series rather than a modeling mistake. Lo and MacKinlay's model-selection risk finding and White's Reality Check are the two papers worth rereading before you finalize any of the steps above; both were written specifically to justify exactly this kind of discipline.
A One-Page Checklist Before You Trust Any Result
Run through these before you deploy capital or submit a paper:
- Is every feature and price built from point-in-time data, with a real knowledge date attached?
- Does a genuine holdout set exist, one that was never touched during model development?
- Were parameters and thresholds fixed before the test period began, not after seeing how they'd perform?
- Is there a log of every search, tune, and comparison attempted, including the ones that didn't make the final cut?
When a check fails, the fix is specific, not a shrug. No holdout means you build one now, even retroactively, and treat everything reported so far as provisional. Data without timestamps means you apply a conservative lag (60 to 90 days for quarterly fundamentals is a reasonable default) and rebuild the test from scratch. A long, uncounted trail of trials means you apply Benjamini-Hochberg FDR or a full Reality Check before trusting the headline number.
The decision rule is simple: deploy only when point-in-time data, a real holdout, and a corrected significance test all agree the result holds. Hold when one of those three is missing but fixable quickly. Rework when the model only survives on the exact historical window it was built from and falls apart under a shift test or regime stress test.
What Does a Worked Reality Check Example Actually Show?
Here's a simplified simulation that makes the correction concrete. Generate pure random-walk price data with no embedded signal at all, then test 200 candidate trading rules against it (varying moving-average windows, thresholds, and lookback periods).
- Generate null data: a random walk with no real predictive structure.
- Run all 200 candidate rules against that data and record each one's Sharpe ratio.
- Report the naive result: whichever rule scored highest, taken at face value.
- Apply White's Reality Check: bootstrap resample the full set of 200 rules together many times, building a null distribution for "the best Sharpe you'd expect from 200 random trials," then compare your actual best Sharpe against that distribution to get a corrected p-value.
| Metric | Naive Result | Reality-Check-Adjusted Result |
|---|---|---|
| Best Sharpe ratio reported | High, standout performer among 200 trials | Same raw number, now reinterpreted |
| Statistical significance | Looks significant at face value (p < 0.05 if tested alone) | Corrected p-value often well above 0.05 once all 200 trials are accounted for |
| Interpretation | "We found a working strategy" | "The best of 200 random trials looks impressive by chance alone" |
The gap between those two columns is the entire point of the exercise. A rule that looks great in isolation frequently turns out unremarkable once you account for how many other rules you tried and quietly discarded. The interpretation for a trading desk: a corrected p-value that stays comfortably below 0.05 after Reality Check adjustment is a genuine candidate for further paper-trading. A corrected p-value that jumps well above 0.05 once the full trial count is accounted for means you found the best of a large batch of noise, not a real edge, and the honest move is to reject it rather than deploy it.
How Should You Report Tests So Others Can Verify Your Work?
A reproducible, trustworthy writeup discloses the following, every time:
- The total number of tests or model variants tried, not just the ones that made the final report.
- Whether a pre-registration or written analysis plan existed before results were seen, and a link to it if so.
- The data vintage and a description of the point-in-time database used, so a reviewer can check for look-ahead leakage independently.
- Code that reproduces the entire selection process end-to-end, not just the final model's training script.
- Full disclosure of any post-hoc searches, subgroup analyses, or dropped variables, even the ones that didn't "work."
Registered reports, where a journal accepts a study's design and analysis plan before data collection even begins, are one of the highest-integrity pathways available for confirmatory research, precisely because they make HARKing structurally impossible. For proprietary trading research where sharing raw market data isn't an option, package your selection code and a synthetic or anonymized dataset that preserves the statistical properties an external auditor needs, without exposing sensitive positions or data licensing you can't legally share.
An Editorial Note on Why Snooping Keeps Fooling Smart People
The uncomfortable truth about data snooping bias is that it isn't a beginner's mistake. It's a professional's mistake, because professionals are the ones with enough data, enough compute, and enough patience to run the thousands of comparisons that make a false positive statistically inevitable. A junior analyst testing three trading rules by hand is far less likely to snoop than a well-funded team running a genetic-algorithm search across 50,000 parameter combinations overnight. Scale is the risk factor, not carelessness.
What gets underestimated most is how much snooping hides in tooling rather than intent. Nobody sits down planning to p-hack. They sit down with a hyperparameter grid search, a backtesting library that doesn't timestamp its data by default, and a deadline. The bias creeps in through the defaults of the software, not through dishonesty. That's why point-in-time data architecture matters more than willpower: it removes the opportunity to leak rather than relying on the researcher to notice they're leaking.
If you want to stress-test your own pipeline against exactly this failure mode, clean, accurately time-aligned historical intraday data removes one entire category of leak before you write a single line of strategy code. Backtestmarket's minute-bar datasets are built to import directly into MT4 and MT5 without the reconstruction guesswork that introduces look-ahead errors in the first place, which is a smaller thing than a Reality Check, but it's the thing that makes the Reality Check worth running.
Frequently Asked Questions About Data Snooping Bias
What's the simplest way to explain data snooping bias to a non-statistician?
It's the error of finding a pattern by searching through the same data many times, then presenting that pattern as if you'd predicted it in advance. The more times you search, the more likely you are to find something that looks meaningful but isn't.
Is data snooping bias the same thing as overfitting?
They're closely related but not identical. Overfitting describes a model that fits its training data too closely and generalizes poorly. Data snooping describes the process that produces that overfit model, reusing the same dataset across exploration and confirmation without properly accounting for how many attempts were made.
How many trading rules can you test before you need a correction?
There's no fixed threshold, but the honest answer is that you need some correction the moment you've run more than one comparison and only reported the winner. Even five or ten candidate rules tested against the same price history warrant a Bonferroni adjustment or, better, a Reality Check against the full set tried.
Does cross-validation fully solve data snooping bias?
Standard k-fold cross-validation helps but doesn't fully solve it, especially for time series, because it can shuffle data and destroy time order, letting future information leak into training folds. Purged or walk-forward cross-validation, which respects time order and adds a gap around fold boundaries, is a more reliable defense for backtesting.
What's the fastest diagnostic test for look-ahead bias in an existing backtest?
Run a T+1 shift test: lag every signal forward by one bar and rerun the simulation. A real strategy's performance should degrade noticeably. If it barely changes, the model is likely using information that wasn't actually available at that timestamp.
Sources
- Lo and MacKinlay (1990) — data snooping in finance (MIT copy)
- A reality check for data snooping (White, 2000)
- Look-Ahead Bias: taxonomy and measured impact (MarketMaker blog)
- How much Sharpe does a look-ahead leak manufacture? (controlled study)
- University of Texas — Data snooping and hidden comparisons (statmistakes)
Recommended
- Anomalies EAs — BacktestMarket | BacktestMarket
- Blog | BacktestMarket | BacktestMarket
- BacktestMarket — Professional Trading Data & Expert Advisors | BacktestMarket
- BacktestMarket — Professional Trading Data & Expert Advisors | BacktestMarket
Related resources
Explore BacktestMarket's historical data packs to put the ideas in this article into practice.