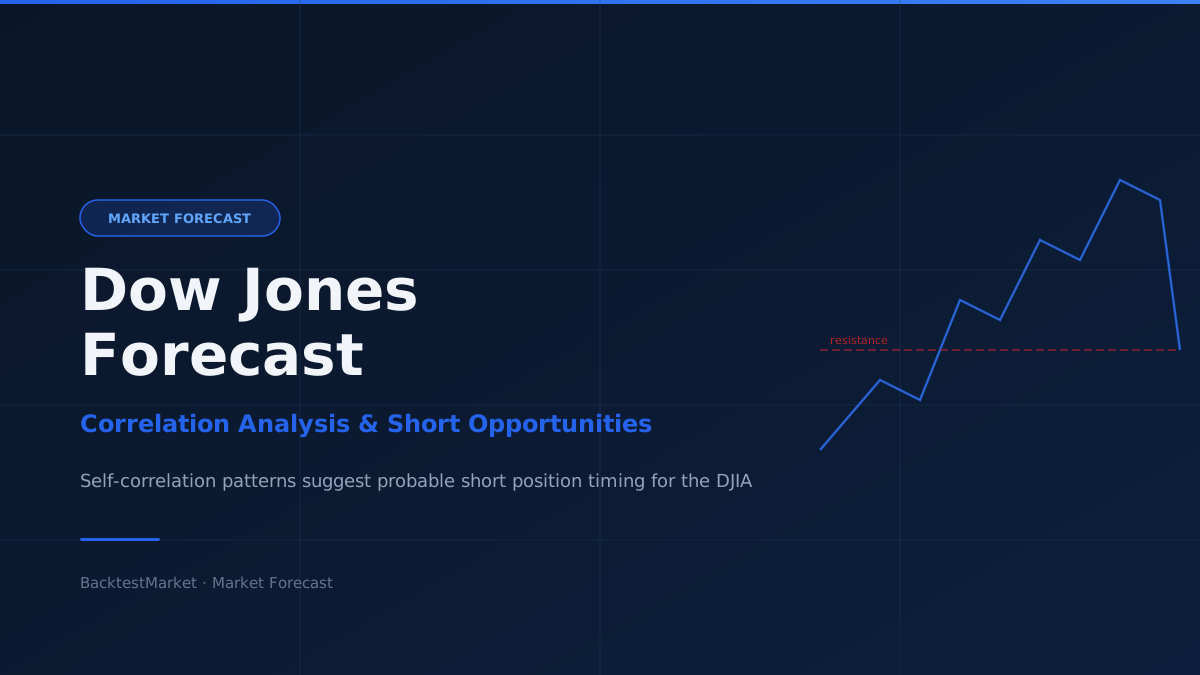
Dow Jones Self-Correlation Pattern
The Dow Jones Industrial Average is currently exhibiting a fascinating self-correlation pattern. The index is repeating, from January 2016 to today with elevated correlation, the same movement it made from August 2015 to January 2016.
This kind of pattern — where a market replays a previous segment of its own price history — provides a probabilistic directional signal for disciplined traders.
Current Positions
Approximately two weeks ago I opened short positions on both the S&P 500 and the Dow Jones Industrial Average. These positions are currently in small gain.
On EUR/USD I established a short trade in a blue area on the chart, with half the position closed at gains on Friday. The dollar weakness that has been dominating markets is showing early signs of exhaustion.
The Forecast
Based on the self-correlation pattern, there is a high probability that the Dow Jones will move downward next week.
The setup is either:
- A great opportunity — the pattern completes and we take profit on the short, or
- A perfect bear trap — the market reverses and squeezes late shorts
This ambiguity is precisely why we manage it with a defined stop and let the market resolve itself.
How to Trade It
My suggestion is simple: take position, place your stop and let the market move.
Do not try to predict the exact outcome — the job of the trader is to identify a good risk/reward situation, enter, set a stop, and allow price to develop. The short-side setup here is attractive because:
- The correlation pattern gives a directional bias
- The stop loss is clearly defined above recent highs
- The potential return is multiple times the risk
Whether it resolves as a winner or a loser, trading it is the right decision given the setup.
Cesare Gonzi