Most traders analyse one instrument at a time. But financial markets do not move in isolation — currencies, commodities, bonds, and equities are all interconnected through the global economy. Understanding these relationships gives you a broader view of market conditions and, more practically, helps you avoid taking on unintended risk.
Successful trading requires a perspective that goes beyond the forex world.
What Is Correlation?
Correlation measures the degree to which two assets move together. A positive correlation means they tend to move in the same direction; a negative correlation means they tend to move in opposite directions.
Correlation coefficients range from −1 to +1:
- +1.0 = perfect positive correlation (always move together)
- 0.0 = no relationship
- −1.0 = perfect negative correlation (always move in opposite directions)
In practice, correlations are never perfectly stable. They shift as economic conditions change, which means correlation analysis requires ongoing monitoring rather than one-time calculation.
Key Correlations Every Forex Trader Should Know
Australian Dollar and Gold
Australia is one of the world's largest producers and exporters of gold. When global demand for gold rises — often during periods of economic uncertainty — Australia's export revenues increase, supporting the Australian dollar.
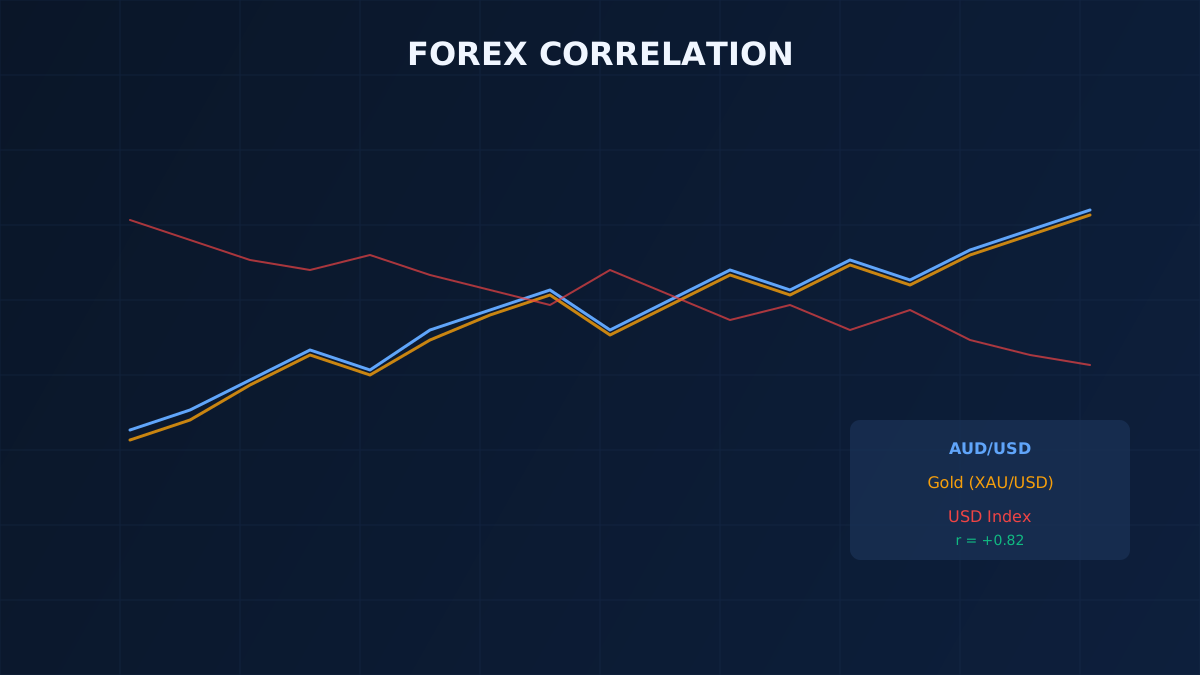
The AUD/USD has a historically strong positive correlation with gold prices (XAU/USD). When gold rallies, AUD/USD tends to strengthen. When gold falls, AUD/USD tends to weaken.
This relationship is not mechanical — it can break down during risk-off events when investors sell all risky assets simultaneously — but it holds strongly enough over time to be a useful confirmation filter.
Gold and the US Dollar
Gold is priced in US dollars globally. This creates a structural inverse relationship: when the USD strengthens, gold becomes more expensive for buyers in other currencies, reducing demand and pushing the price down.
Conversely, when the dollar weakens, gold becomes cheaper for international buyers, supporting demand and prices.
XAU/USD and DXY (Dollar Index) typically move inversely. Traders use this relationship to:
- Confirm breakout signals in either market
- Identify divergences where the relationship has temporarily broken down
Crude Oil and the US Dollar
Oil is also denominated in USD on global markets. The mechanics are similar to gold: a stronger dollar makes oil more expensive for non-dollar buyers, suppressing demand. A weaker dollar reduces the cost, supporting demand.
Beyond the currency mechanism, large oil exporters accumulate USD from their sales. When oil prices rise, petrodollar recycling into USD-denominated assets increases, creating additional dollar demand that can partially offset the inverse relationship.
The oil-dollar correlation is strongest when moves are driven by pure supply/demand dynamics rather than by geopolitical events that simultaneously affect both.
Trading Applications
Confirming Trade Direction
If you are looking to buy AUD/USD and you check the gold chart and see gold rallying strongly, that is a confirming signal. If gold is selling off while you plan an AUD/USD long, that divergence warrants caution.
Diversification — or Its Absence
Trading EUR/USD and GBP/USD simultaneously in the same direction is not as diversified as it might appear. These pairs have a high positive correlation because both the Euro and the Pound tend to strengthen or weaken together against the USD.
If you are long both pairs and dollar sentiment turns bullish, you are effectively doubling your dollar exposure. Using correlation data helps you build a portfolio where your positions are genuinely independent.
Hedging
Pairs with strong negative correlation can be used for partial hedges. For example, going short EUR/USD and long USD/CHF simultaneously provides some offset if dollar sentiment unexpectedly shifts. The trade-off is that it also caps profit potential.
Calculating Correlations Yourself
You can calculate rolling correlations using Excel or Python. A 20-day or 60-day rolling window is commonly used to capture medium-term relationship strength without being overly sensitive to short-term noise.
import pandas as pd

# Assuming df has columns 'AUDUSD' and 'GOLD'
correlation = df['AUDUSD'].rolling(60).corr(df['GOLD'])
Plotting this over time shows you when the correlation is historically strong or when it has broken down — which can itself be a trading signal.
Important Caveat
Correlations are descriptive, not predictive. They tell you what has been true historically; they do not guarantee what will happen next. Use correlation as one input in your analysis, not as a standalone trading signal.