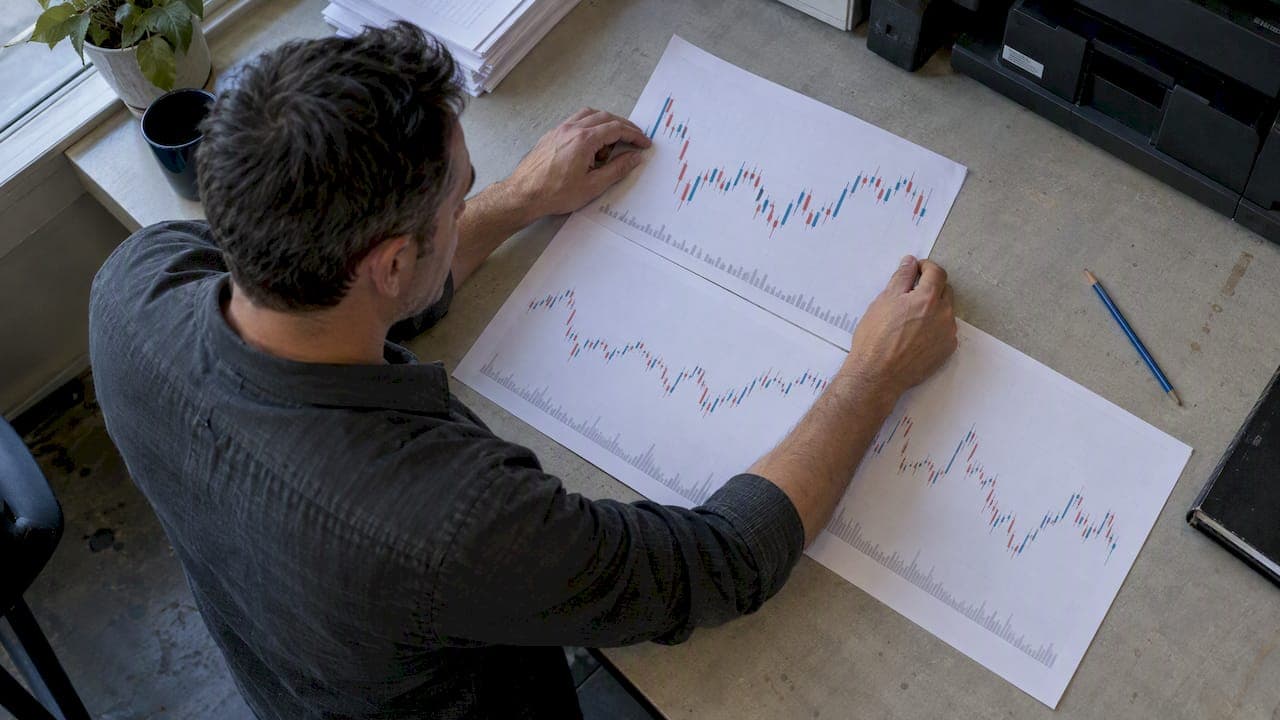
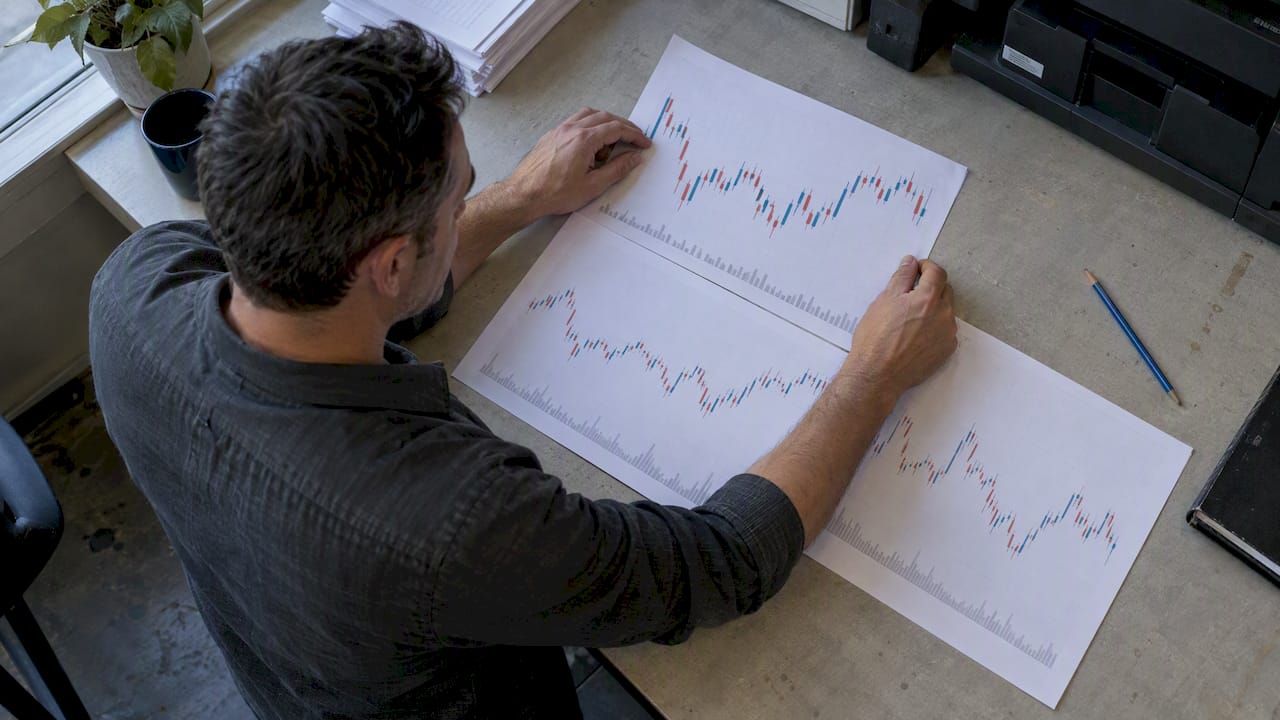
Use a timeframe that matches your holding period: scalpers tend to use very short charts, day traders use intraday charts, swing traders use higher timeframes, and position traders use longer-term charts. A timeframe is simply the period one candle or bar represents on a chart. The right choice depends on how long you hold trades, how much screen time you have, and how much your strategy depends on clean data.
TL;DR:
- Beginners should start on higher timeframes, moving faster only after a strategy proves stable and execution, data quality, and screen time can keep pace.
- Use the Daily chart for trend and key zones, the Hourly chart for structure, and a shorter chart for entries; avoid analyzing more than three.
- Indicator readings change with chart timeframe, so traders should reassess period counts when switching chart speeds rather than carrying settings over unchanged.
- Standard OHLC data can hide spread changes, gaps, and slippage, so scalping backtests need documented spread handling and preferably higher fidelity data before risking capital.
- For trades held hours or days, documented minute bar data is usually sufficient, while daily data can support swing systems based on broader price structure.
Table of Contents
- Common Forex Chart Timeframes Explained
- How to Choose a Timeframe by Trading Style and Objectives
- Multi-Timeframe Top-Down Analysis: A Practical Workflow
- Data and Practical Limits When Using Short Timeframes
- Practical Examples: Choosing Timeframes for Three Common Setups
- Balancing Execution Demands, Data Quality, and Time Commitment
- Getting Clean Minute-Bar Data for Backtesting With BacktestMarket
- FAQ
- Sources
Common Forex Chart Timeframes Explained
A timeframe tells you how much price action is packed into a single candle. On a short-term chart, each bar covers a brief period; on a daily chart, each bar covers a full trading day. The shorter the bar, the more noise it carries, and the more exposed your analysis becomes to spread changes, slippage, and random price wiggles that have nothing to do with the trend.
Minute charts show short-term market microstructure. They react to every tick of order flow, which makes them useful for scalpers chasing small, fast moves, but it also means a huge share of what you see is noise rather than signal. Spreads matter more on very short timeframes because trading costs can erase a small potential profit.
Intraday charts strike a more usable balance. They filter out a lot of the tick-by-tick randomness while still updating often enough to support same-day decisions. Most day-trading setups, including breakout and momentum strategies, are built around this band because it gives enough bars per session to find entries without drowning in false signals.
Higher timeframes smooth price action into clearer trends. Support and resistance levels drawn on a Daily or Weekly chart tend to hold up better than the same lines drawn on a five-minute chart, simply because fewer irrelevant price swings have been averaged in. This is why position traders and swing traders lean on these timeframes: fewer trades, fewer false signals, and less time spent watching screens.
Indicators scale with the timeframe you apply them to, not just with their own settings. An Average True Range (ATR) indicator measures volatility over the periods represented by its chart, so its interpretation changes with the timeframe. Moving averages behave the same way: their interpretation depends on the timeframe and the number of periods used. Carrying an indicator setting from one timeframe to another without adjusting the period count is one of the most common mistakes traders make when they switch chart speeds.
A quick reference for how the major timeframes stack up:
- Short-term charts: brief periods per bar, high noise, best suited to scalping and very short holds.
- Intraday charts: a workable middle ground for active intraday trading.
- Hourly and higher charts: clearer intraday and short swing structure with fewer false breakouts.
- Daily charts: one trading day per bar, a standard reference for swing and position bias.
- Long-term charts: used mainly for trend context and macro positioning.
How to Choose a Timeframe by Trading Style and Objectives
Your trading style should decide your timeframe, not the other way around. Picking a chart speed first and then forcing a strategy onto it is how most beginners end up frustrated by signals that do not match how much time or capital they actually have.
- Match the timeframe to your expected holding period. If you plan to be in and out of a trade quickly, use a short-term chart; if you are comfortable holding for longer, a higher timeframe can give you a more stable read.
- Match the timeframe to your available screen time. Scalping on a very short chart demands near-constant attention, while swing trading on higher timeframes can be checked periodically without missing much.
- Match the timeframe to your backtest sample size. A strategy tested on daily data may generate fewer trades than the same logic tested on an intraday chart, which matters for how confident you can be in the results.
- Start on higher timeframes if you are new. These charts move slowly enough to let you think through a decision instead of reacting on instinct, and the lessons transfer more cleanly to faster timeframes later.
- Progress downward deliberately. Once a strategy proves stable on a higher timeframe across a meaningful number of trades, move to a faster chart only after confirming your execution speed and data quality can keep up with the pace.
- Reassess based on results and infrastructure. If slippage or missed entries are eating into a lower-timeframe strategy's edge, that is often a signal to move up a timeframe rather than to fight the execution problem directly.
Beginners generally do best starting on a higher timeframe. These timeframes update often enough to stay engaging without punishing small delays in order execution, and they produce chart patterns that hold up well enough to learn the basics of trend, structure, and risk placement.
Multi-Timeframe Top-Down Analysis: A Practical Workflow
Professional traders rarely trade off a single chart. The standard approach, often called top-down or multiple timeframe analysis, uses a higher timeframe to set directional bias, a middle timeframe to map structure, and a lower timeframe to time the actual entry.
A typical three-timeframe setup looks like this:
- Daily chart: establishes the overall trend direction and marks the major support and resistance zones to consider.
- Hourly chart: shows how price is structuring itself within the higher-timeframe trend, including pullbacks, consolidations, and breakout attempts.
- Shorter-term chart: pinpoints the entry trigger, such as a candle close above a short-term resistance level that aligns with the higher-timeframe structure and bias.
If the Daily chart points up, look for long setups on a lower chart, and enter only when its signal agrees with the higher-timeframe bias. Trades that fight the Daily trend get skipped regardless of how clean the 15-minute signal looks.
Most experienced traders cap their analysis at two or three timeframes for a reason: adding a fourth or fifth chart tends to produce conflicting signals rather than extra clarity, according to BabyPips. More charts do not mean more information once you pass that point, just more noise to reconcile.
Pro Tip: Pick your entry timeframe based on the pair's typical volatility and liquidity: a major pair like EUR/USD may support a faster entry chart, while a thinner cross pair may need a slower chart to avoid false triggers from erratic spreads.
Data and Practical Limits When Using Short Timeframes
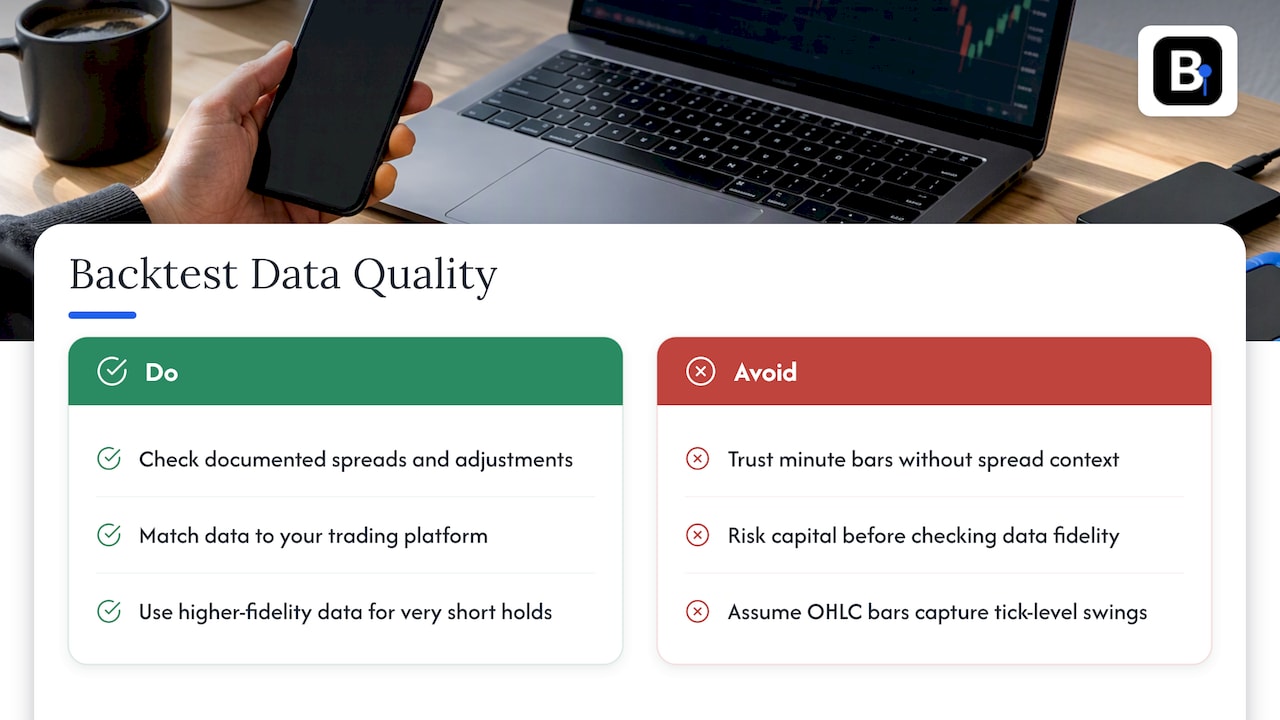
The lower the timeframe, the more your backtest results depend on data quality rather than strategy logic. Standard OHLC bars record only the open, high, low, and close for each period, which means a short-period bar can hide many price swings, spread widenings, and even brief liquidity gaps that never show up in the summary numbers.
This matters most for scalping strategies, where the difference between a profitable backtest and a losing live strategy often comes down to details the bar simply does not capture: the exact spread at the moment of entry, whether a stop was actually filled at the price shown, and whether gaps between ticks created slippage the backtest never accounted for. A naive backtest run on plain minute bars without any spread or tick context can show inflated returns that collapse the moment the strategy goes live.
Testing low-timeframe strategies using standard OHLC bars is often flawed because the bars lack tick-level data or contemporaneous spread information; clean minute-bar historical data with documented adjustments is essential for realistic backtests.
The practical fix is not necessarily tick-by-tick data for every strategy, but it does mean knowing what your data includes before you trust a backtest built on it. Look for datasets that document how spreads and adjustments were handled and that are built specifically for import into the platform you trade on, since a mismatch between data source and execution platform is one of the quieter ways backtests mislead traders. Traders comparing backtesting workflows across different tooling, including crypto-focused platforms like Darkbot's documentation, will notice the same principle applies regardless of asset class: the quality of the historical data sets the ceiling for how much you can trust the result.
If a strategy's edge depends on very short holds, invest in higher-fidelity data before risking real capital on it. If the strategy holds for hours or days, well-documented minute-bar data is usually sufficient, since the noise that tick data captures matters far less over a longer hold.
Practical Examples: Choosing Timeframes for Three Common Setups
Matching the timeframe to the setup is easier with a concrete walkthrough than with general rules alone.
- Short-term scalping breakout: the entry trigger is a fast break of a tight consolidation range, the stop sits just beyond the range on the opposite side, and execution needs to happen promptly after the signal candle closes. This setup demands minute-bar data with documented spread behavior at minimum, since a single pip of unaccounted slippage can flip the trade's expectancy.
- Intraday moving-average setup with shorter-term confirmation: the hourly chart identifies a moving-average crossover or bounce, and a shorter-term chart is used to fine-tune the entry once the signal is in place, with the stop placed beyond the most recent swing point. Clean minute or hourly data is enough here, since the strategy is not sensitive to sub-minute execution timing.
- Swing trend-following on higher timeframes: entries follow a pullback into a trend-aligned zone, stops sit well beyond recent swing structure to avoid routine noise, and trades are held for longer periods with only occasional chart checks. Daily data is sufficient for both live decisions and backtesting, since the strategy's logic operates on a scale where minute-level noise has no real effect on the outcome.
Balancing Execution Demands, Data Quality, and Time Commitment
The honest tradeoff in timeframe selection is not speed versus profit, it is speed versus how forgiving your infrastructure needs to be. Lower timeframes reward traders who have fast execution, tight broker spreads, and backtest data clean enough to trust, while higher timeframes forgive a slower setup almost entirely.
Before moving to a lower timeframe, check that execution latency matches your signal speed, your backtest sample is large enough to be meaningful, data adjustments are documented, and you can sustain the monitoring required. Skipping any one of these is how traders end up with a strategy that looked great on a chart and fell apart in live conditions. Validate on well-documented data before committing real capital to a faster chart.
— Start
Getting Clean Minute-Bar Data for Backtesting With BacktestMarket
Once you know which timeframe fits your strategy, the next problem is sourcing data you can actually trust for it. We built BacktestMarket around exactly that gap: ready-to-import, clean minute-bar intraday datasets across forex, metals, stock indices, and more, packaged so they drop straight into MT4 or MT5 without manual conversion.
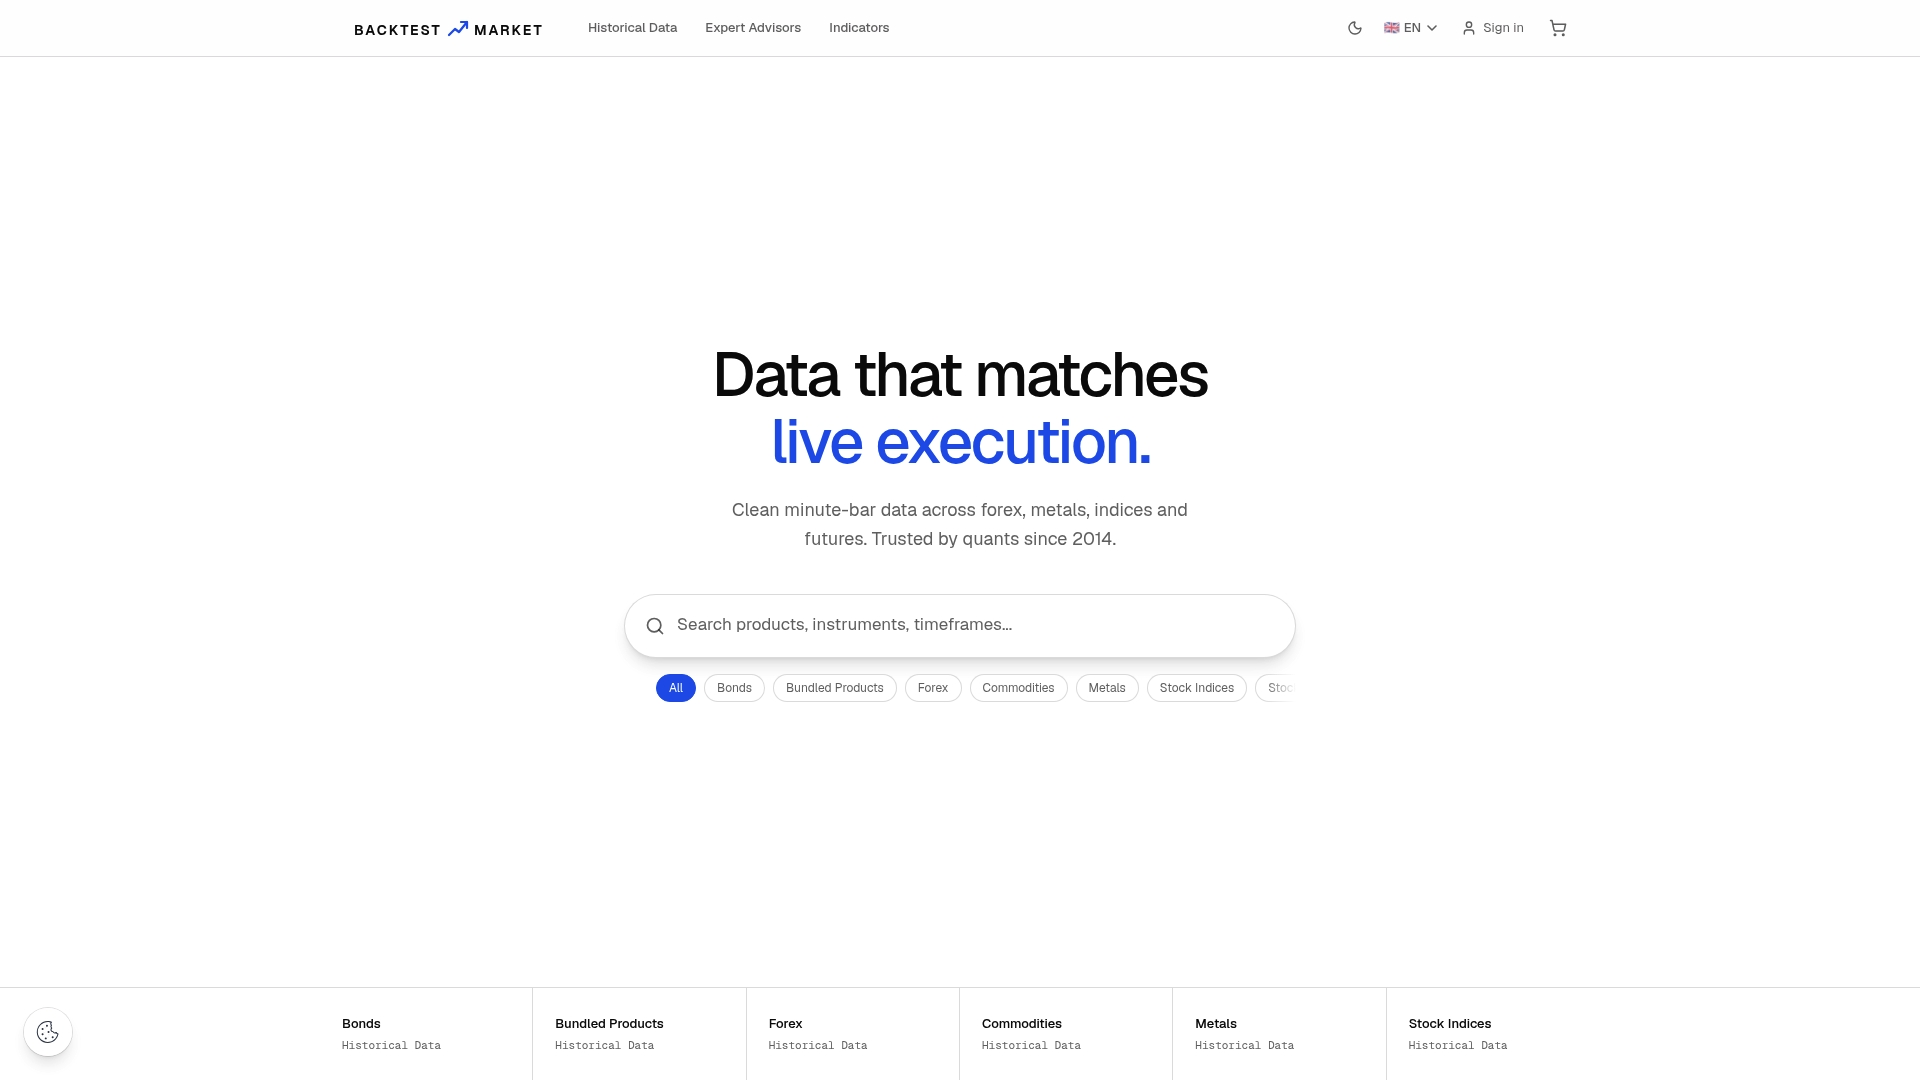
Our data is documented and verified bar by bar, with adjustments documented for backtesting. That distinction is exactly what separates a scalping or intraday strategy that survives live trading from one that only ever worked on paper.
- Browse the Historical Data catalog for minute-bar datasets by instrument.
- Check the Annual Plan for ongoing access to updated datasets at 119 EUR per year.
- Pair your data with ready-made Expert Advisors and Indicators for strategy development.
Compare data for your instrument and timeframe with your current backtest before you commit to a lower timeframe live.
FAQ
What time are the forex trading sessions?
Forex trading runs through overlapping sessions centered on major financial hubs, typically grouped as the Sydney, Tokyo, London, and New York sessions, with the London and New York overlap generally seen as the most active window. Exact hours shift with daylight saving changes in each region, so traders usually check session times against their own local clock rather than a fixed universal schedule.
Where can I find historical forex data?
Historical forex data is available from broker platforms, free aggregator sites, and specialized vendors that package clean minute-bar datasets for direct import into MT4 or MT5. The quality varies widely, so check whether spreads, gaps, and adjustments are documented before using any dataset for backtesting.
What is the 90% rule in forex?
The SEC does warn that forex trading carries substantial risk, including the potential to lose more than your initial capital because of leverage, highlighting the risks of forex trading.
What are the historical forex data for Yahoo Finance?
Yahoo Finance offers free historical forex price data for major currency pairs, typically at daily resolution with limited intraday history. For backtesting strategies below the daily timeframe, traders generally need a dedicated minute-bar data provider instead, since free sources rarely document spread or adjustment details closely enough for reliable intraday testing.
Sources
Recommended
- Four Forex Minute Data Sources for Quants Ready for MT4/MT5
- 3 Ways to Remove Weekend Bars From Forex Data for Backtesting
- Stop False Backtests: 3 QA Checks for MT4/MT5 Import Ready Datasets
- Three Ways to Run an MT5 Portfolio Backtest With Clean Minute Bars
Related resources
Explore BacktestMarket's Forex historical data to put the ideas in this article into practice.