

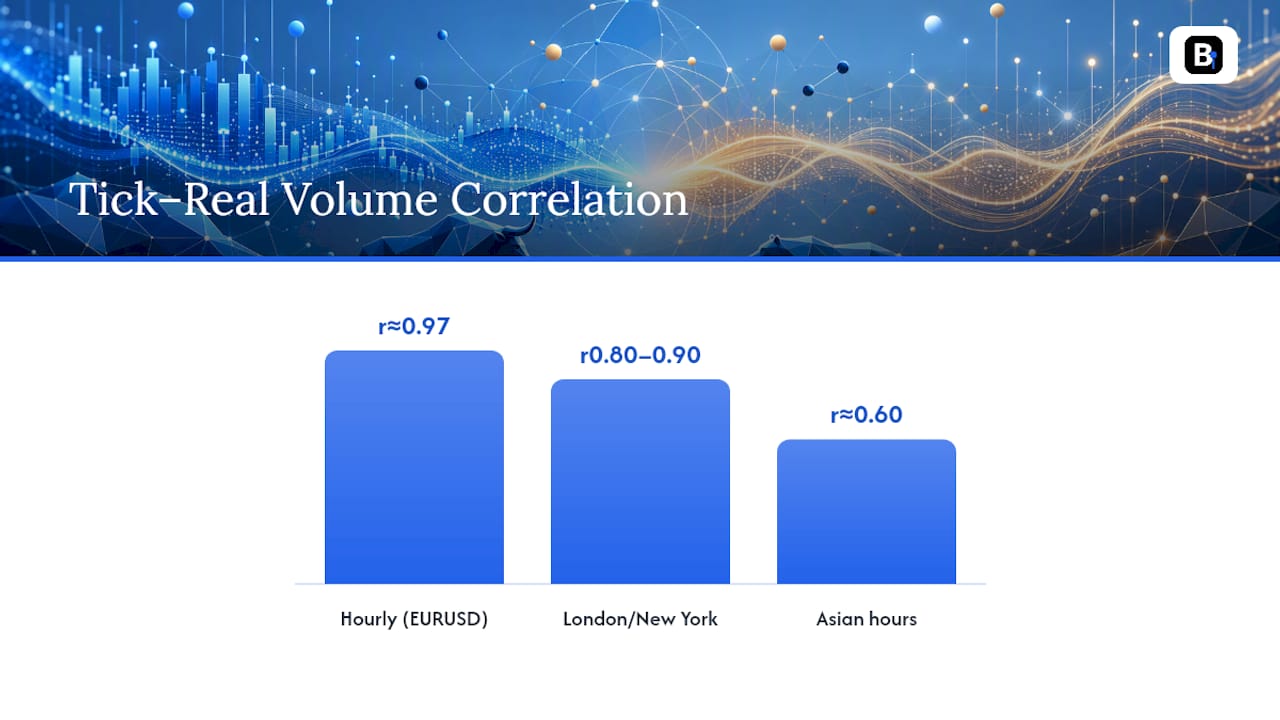
Tick volume is a usable stand in for real traded volume in spot forex, but only for intraday work during liquid sessions, and only if you treat it as an activity gauge rather than a measure of money changing hands. The fxvolume study found hourly Pearson correlations near 0.97 between tick counts and ECN traded volume on EURUSD, with r² above 93%. That is strong, but it comes with three catches worth knowing before you build a strategy around it:
- Session dependence: correlations that hold at 0.80 to 0.90 during London and New York hours can drop toward 0.60 in the Asian session, according to comparative work from Forex-basics.
- Feed differences: tick volume is broker specific, so the same pair on two different platforms can show different counts for the same hour.
- Trade-size blindness: a single 500 lot institutional order and fifty retail 1 lot orders can generate the same number of ticks, so volume spikes don't tell you who moved the market.
Key Takeaways
Tick volume tracks real traded volume closely on hourly bars for major pairs during liquid sessions, but it measures quote activity, not order size, and breaks down for structural analysis.
| Point | Details |
|---|---|
| Hourly correlation is strong | EURUSD tick volume correlates with ECN traded volume at Pearson r ≈ 0.97 on hourly bars. |
| Session timing matters | Correlations fall from roughly 0.80 to 0.90 in London/New York down toward 0.60 in Asian hours. |
| Tick volume can't see size | A single large block trade and dozens of small retail orders can produce identical tick counts. |
| Use real volume for structure | Reserve CME futures or ECN volume for order-flow and institutional-positioning questions. |
| Backtest on consistent data | Datasets like Backtestmarket's Forex Major Full Pack and Forex Minors remove broker-feed inconsistency from strategy testing. |
Primary sources and further reading
The empirical case rests on the fxvolume correlation study and the 2016 tick-classification study. Platform explainers from Trading Wyckoff, forex-basics.com, and FXGlory cover platform mechanics and practical caveats. A live TradingView chart comparison illustrates the visual gap between the two metrics.
Table of Contents
- Forex Tick Volume vs Real Volume: The Core Definitions
- How Do MT4 and MT5 Actually Count Ticks?
- Do Studies Prove Tick Volume Tracks Real Volume?
- When Should You Trust Tick Volume for Trading Signals?
- What Mistakes Do Traders Make With Tick Volume?
- Where Can You Find Real Traded Volume Data?
- Which Volume Metric Should You Use Right Now?
- Get Clean Data Instead of Guessing at Broker Feeds
- Frequently Asked Questions
- Sources
Forex Tick Volume vs Real Volume: The Core Definitions
Tick volume counts the number of price updates, or quote changes, that occur within a bar. It says nothing about how many units traded, only how often the price moved. MetaTrader's tick_volume field is exactly this: a running tally of quote changes, not contracts or lots.
Real, or traded, volume is the actual number of contracts, shares, or lots exchanged. It comes from a centralized ledger, which is why exchanges publish it directly. CME currency futures report this number every session because every contract clears through one venue.
Spot forex has no such ledger. It trades over the counter across a web of banks, brokers, and electronic communication networks, so no single entity sees the whole market. That structural gap is the entire reason tick volume exists as a workaround, and also why it will never be a perfect substitute. Trading Wyckoff draws this distinction plainly: tick frequency measures activity, order size measures liquidity, and the two are not interchangeable.
How Do MT4 and MT5 Actually Count Ticks?
Your platform's tick volume reading depends entirely on what your broker's feed sends it, which is why two brokers can show wildly different bars for the same hour on the same pair.
MetaTrader populates the tick_volume field with a straight count of quote updates per bar. The separate real_volume field exists in the specification but sits empty for most retail FX symbols, since no broker actually has access to a consolidated tape. eSignal and similar charting platforms do the same thing under different labels.
What changes the count from broker to broker:
- The liquidity providers feeding that specific broker (more providers streaming quotes generally means more ticks).
- Aggregation settings and how the platform buckets updates into bars.
- Spread and quote-refresh policies, since some feeds throttle updates during quiet periods.
- Vendor-side filtering that strips duplicate or near-identical quotes before they reach your chart.
Before trusting a tick-volume signal in a live strategy, pull up historical bars on that exact broker feed and check whether the pattern holds during your target trading hours.
Do Studies Prove Tick Volume Tracks Real Volume?
The best evidence says yes, but only at certain resolutions. The fxvolume study compared ECN-sourced traded volume (HotSpot, EBS feeds via vendors like Interactive Data and eSignal) against tick counts bucketed by hour, and reported Pearson correlations of 0.9683 for EURUSD, 0.9583 for USDJPY, 0.9894 for GBPUSD, and 0.9714 for EURCHF, with r² values in the 92% to 98% range. On an hourly timeframe, tick counts and real volume move together closely enough that treating one as a proxy for the other is defensible.
That confidence erodes fast once you shrink the window. Correlations weaken on sub-minute bars, in thin sessions, and across instruments outside the major pairs the study focused on. A separate 2016 analysis of 1.2 million forex trades found that tick-based direction classification, a related but distinct use of tick data, is only about 67% accurate, and gets worse for zero-tick trades and as spreads narrow.
Statistic callout: Studies show that hourly aggregated tick counts on EURUSD have a strong correlation with ECN traded volume, whereas accuracy of trade-direction classification from tick data alone at the individual trade level is modest.
Read those two numbers together and the pattern is clear: aggregate hourly tick counts are a solid volume proxy, but tick data at the trade-by-trade level is an approximation, not a record.
When Should You Trust Tick Volume for Trading Signals?
Tick volume earns its keep during the sessions where the correlation research actually holds up. Confirming an intraday breakout during London or New York hours, filtering for volatility spikes, or using volume as contextual backup to a price pattern all fall comfortably within what the data supports. What it cannot do is answer structural questions: who is behind a move, whether a spike represents one large order or a flood of small ones, or where real liquidity is pooling. For that, you need order-flow or exchange-based volume, not a tick count.
Given the session dependence in the correlation studies, hourly aggregation is the sweet spot for treating tick volume as a genuine proxy. On 5 to 15 minute bars, expect more noise and a weaker relationship to actual turnover, so use those timeframes for pattern recognition rather than volume-based conviction.
Backtesting raises a separate problem entirely. Because spot forex is decentralized, tick volume is tied to a specific broker's feed, and you cannot cleanly compare it across platforms without normalizing first. If your strategy depends on volume behaving consistently across thousands of historical bars, feed inconsistencies will quietly corrupt your results. That is exactly why serious quant traders test on exchange or futures real volume where it exists, or fall back on a clean, standardized minute-bar dataset like BacktestMarket's forex data so every bar in the backtest comes from one consistent source rather than a patchwork of broker exports.
What Mistakes Do Traders Make With Tick Volume?
The costliest mistake is treating a tick spike as proof of institutional buying or selling pressure. It might be. It might also be a news algorithm firing off fifty micro quotes in three seconds with nobody actually trading a meaningful size.
Common pitfalls worth flagging:
- Reading tick volume as money turnover instead of quote frequency.
- Comparing tick counts across different broker feeds as if they were the same measurement.
- Building a tick-based VWAP and treating it as a structural liquidity signal.
- Ignoring the Asian session's thinner correlation and drawing conclusions that only hold in London or New York hours.
- Trusting bars with sparse or zero ticks, which distort any volume-based indicator built on top of them.
Large institutional block trades and dark liquidity are functionally invisible to tick counts, since a single massive fill generates the same one or two price updates as a tiny retail order.
Pro Tip: Whenever a tick-volume spike looks like it's telling you something important, cross-check it against an independent source, whether that's CME futures volume, a raw ECN feed, or a clean minute-bar dataset, before you act on it.
Where Can You Find Real Traded Volume Data?
For genuine order-size data, three sources dominate. CME currency futures, covering EUR (6E), GBP (6B), and JPY (6J) contracts, publish actual contract volume every session because everything clears through one exchange. Major ECNs like HotSpot and EBS aggregate real executed trade volume from their networks, though access typically requires an institutional or paid data relationship. Commercial data vendors resell cleaned versions of both, often at a price that puts them out of reach for individual traders testing a single strategy.
A practical middle ground is mapping futures volume onto spot behavior during the hours the two overlap, since currency futures and spot FX tend to move in tandem when both markets are active. It's an approximation, not a perfect substitute, and pip-level divergence is normal given the different market structures.
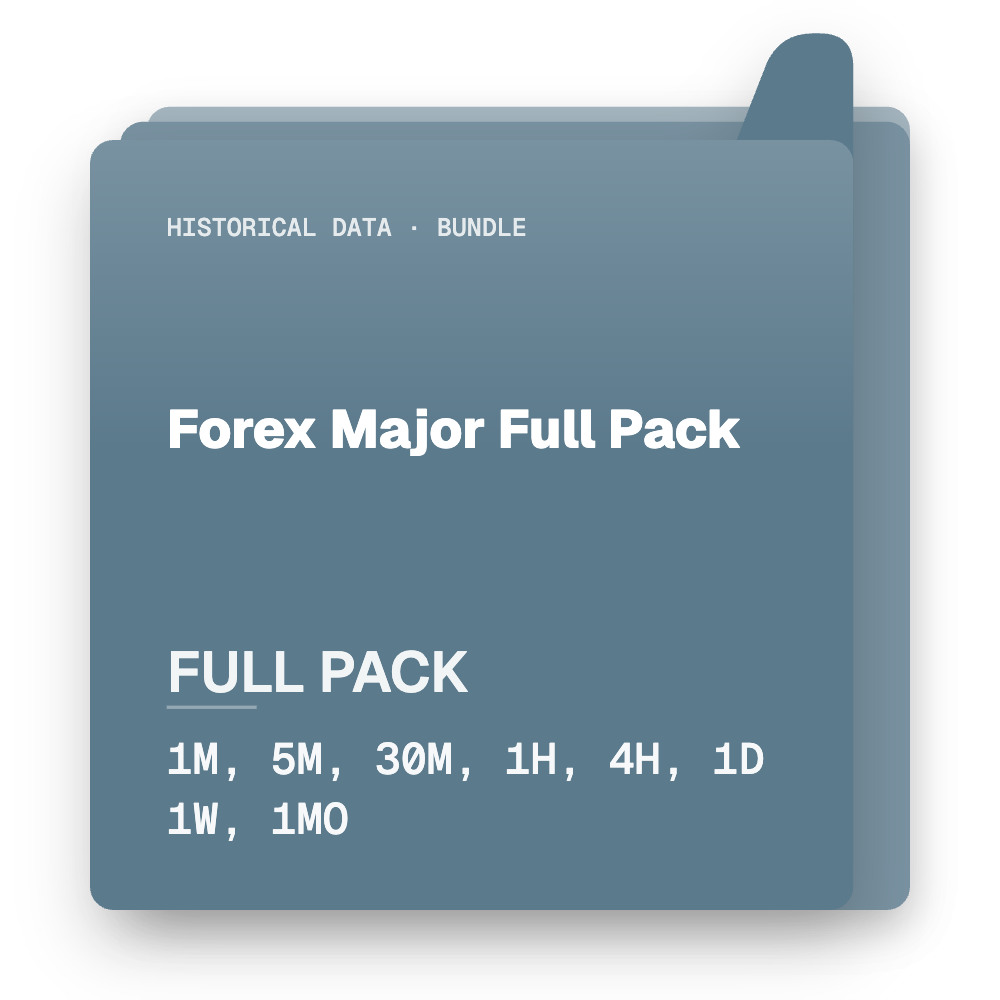
For traders who need reliable inputs without an institutional data budget, a clean, standardized minute-bar historical set, like BacktestMarket's Forex Major Full Pack, removes the broker-feed inconsistency problem entirely by giving every backtest the same underlying data.
Which Volume Metric Should You Use Right Now?
Match the decision to the job in front of you:
- Confirming an intraday breakout in a liquid session — tick volume is fine. Check it against recent hourly correlation on your specific feed first.
- Analyzing structural order flow or institutional positioning — seek real volume from CME futures or an ECN feed; tick counts can't answer this.
- Judging execution quality or slippage — use your broker's own fill data, not tick volume, which has no size information.
- Backtesting a strategy across months of history — use a single clean minute-bar dataset rather than mixed broker exports, to avoid feed artifacts skewing your results.
- Trading outside London/New York hours — discount tick volume signals more heavily, since correlation to real volume weakens in thin sessions.
A practitioner's note on trusting the proxy
Working with both tick and exchange volume across research and backtesting makes one thing obvious: the correlation numbers are real, but they only hold if you respect the session and timeframe they were measured on. Pro Tip: Always re-test your chosen volume proxy against your specific instrument and session before wiring it into a live strategy, not just once at the start.
Get Clean Data Instead of Guessing at Broker Feeds
If tick volume's broker-specific quirks make you nervous about backtesting on it, you're reading the situation correctly, and there's a more direct fix than trying to normalize feeds yourself. Backtestmarket sells complete, clean minute-bar historical datasets built specifically so every bar in your backtest comes from one consistent source instead of a patchwork of MT4 exports.
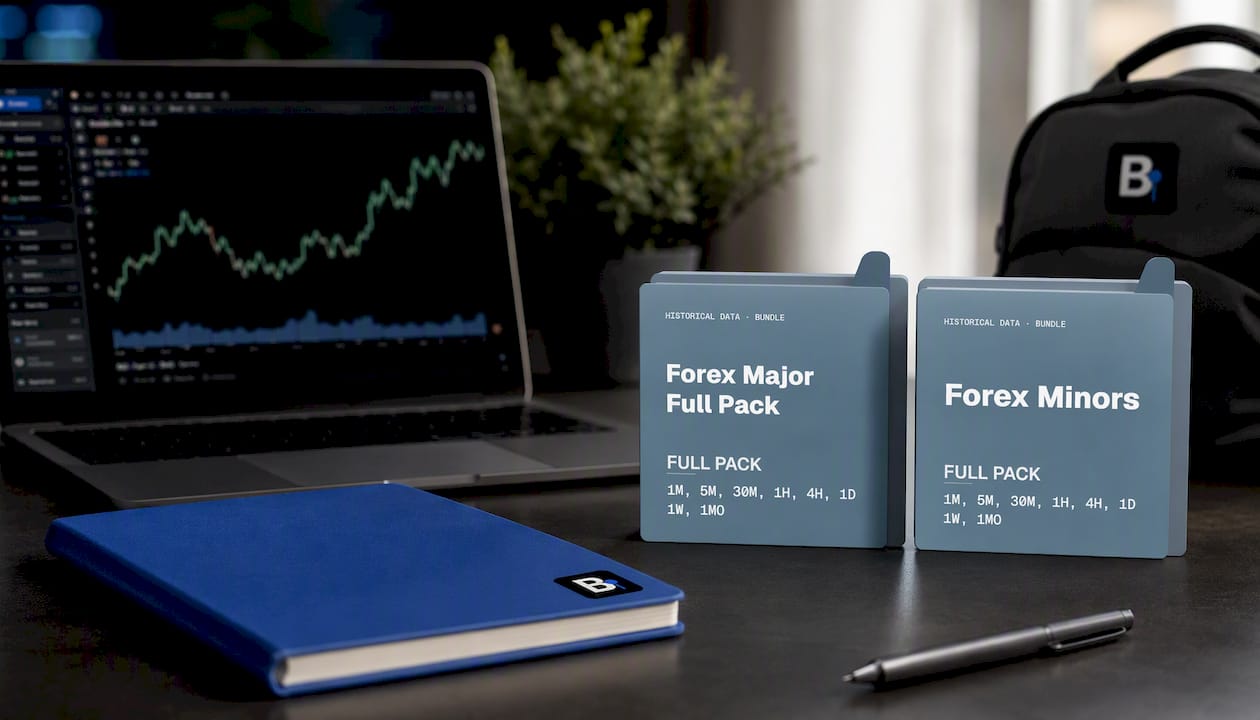
The Forex Major Full Pack covers the major pairs where the tick-to-volume correlation research is strongest, and the Forex Minors set extends that same consistency to a wider currency universe for traders testing across more instruments. Every dataset drops straight into MT4 and MT5 with no reformatting, and if something looks off in the data, you're talking to an actual engineer, not a support ticket queue. Pull up the Forex Major Full Pack today and run your next backtest on data that doesn't shift depending on which broker exported it.
Frequently Asked Questions
Is tick volume the same as real volume in forex?
No. Tick volume counts price updates within a bar, while real volume counts actual contracts or lots traded. They correlate strongly on hourly bars for major pairs but measure fundamentally different things.
Can I use tick volume for backtesting a forex strategy?
You can, but results will vary by broker feed since tick volume is not standardized across platforms. A clean, consistent minute-bar dataset avoids that variability entirely.
Why doesn't MT4 show real volume for forex pairs?
Spot forex trades over the counter across many venues with no central ledger, so brokers have no authoritative traded-volume figure to report. The real_volume field exists in the specification but stays empty for most FX symbols.
Where can I get real traded volume for currencies?
CME currency futures (6E, 6B, 6J contracts) publish genuine traded volume, as do major ECNs like HotSpot and EBS, typically through paid data vendor relationships.
Does tick volume work better on some timeframes than others?
Yes. Correlation to real volume is strongest on hourly bars and weakens noticeably on sub-minute timeframes, so treat short-timeframe tick spikes with more skepticism.
This article is general information, not a substitute for advice from a qualified financial advisor. Consult a qualified financial professional about your own circumstances before acting on anything here.
Sources
- Are price updates a good proxy for actual traded volume in FX? (fxvolume study)
- Tick Volume vs Real Volume: The Difference Almost Nobody Explains | Trading Wyckoff
- Study on tick-based trade classification (2016)
- Forex-basics
- Forex Tick Volume Indicator: Price Updates & False Signals | FXGlory
Recommended
- Blog | BacktestMarket | BacktestMarket
- Forex — BacktestMarket | BacktestMarket
- FOREX Full Pack All Timeframes historical data | BacktestMarket
- BacktestMarket — Professional Trading Data & Expert Advisors | BacktestMarket
Related resources
Explore BacktestMarket's Forex historical data to put the ideas in this article into practice.