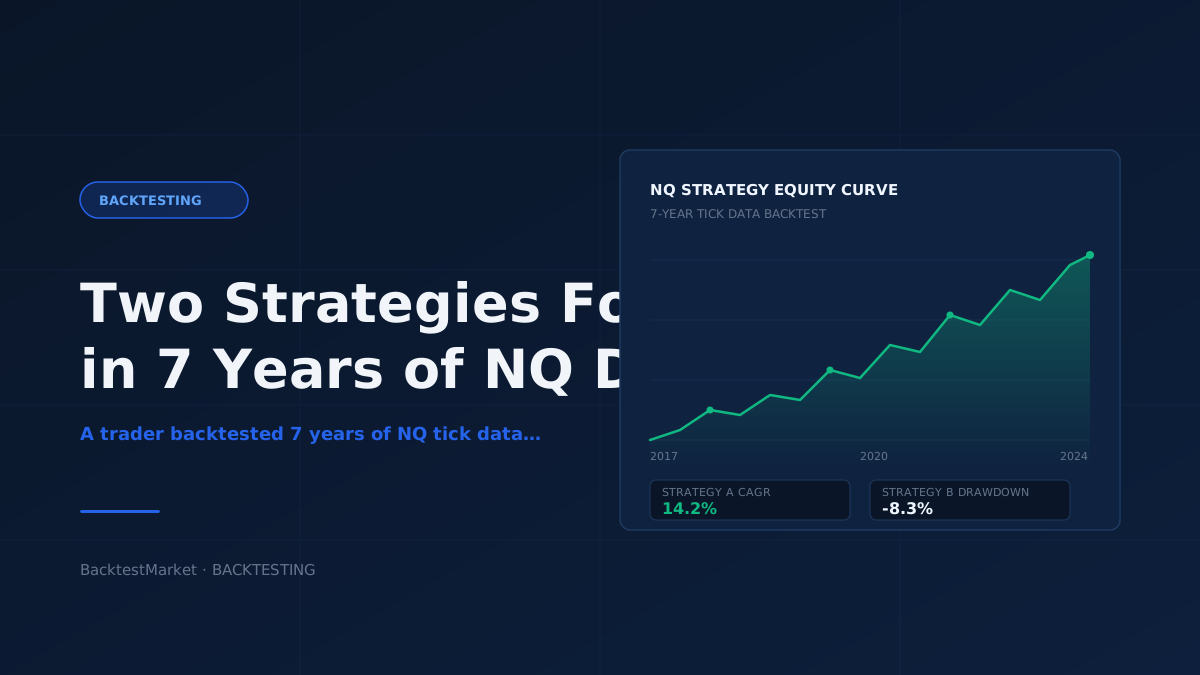
A post recently made the rounds describing a trader who backtested seven years of NQ (Nasdaq-100 futures) tick data and came away with "two strategies so far." No specific win rates, no equity curve screenshots, no promises — just a simple statement that after a long, methodical process, two approaches survived scrutiny. That framing is worth unpacking, because it quietly demonstrates something most retail algorithmic traders get wrong: the amount of data and time it actually takes to find something that holds up.
This article isn't about the specific strategies (we don't know the details, and frankly the details matter less than the process). It's about what a seven-year tick-level backtest on an instrument like NQ actually requires, why "two strategies" out of a long search is a realistic — even encouraging — outcome, and how you can apply the same discipline to your own MT4/MT5 development pipeline.
Why Tick Data and Multi-Year Windows Change the Picture
Most retail EA development starts on a much smaller canvas: a year or two of M1 or M5 bar data, maybe pulled directly from the broker. That's fine for a first pass, but it introduces two well-known problems.
First, bar data compresses information. A single 1-minute candle can hide dozens of price swings, spread fluctuations, and momentary liquidity gaps that a tick-based backtest captures explicitly. For strategies that rely on fast entries, tight stops, or intrabar logic (breakouts, scalping, order-flow-adjacent rules), testing on bars instead of ticks can produce fill assumptions that never happen in live trading. Tick data forces the backtest to simulate price movement the way it actually occurred, tick by tick, which is a meaningfully more honest test of execution.
Second, a short lookback window — six months, a year, even two — almost guarantees you're testing against a single market regime. NQ over the last seven years alone has moved through a pandemic-era liquidity surge, a historic rate-hiking cycle, multiple sharp drawdowns, and several distinct volatility regimes. A strategy that only "works" in one of those regimes isn't an edge — it's a coincidence that happened to align with a specific macro backdrop. Seven years of data forces a strategy to prove itself across bull runs, corrections, low-volatility grinds, and high-volatility shocks. That's a much higher bar, and clearing it means something.
This is also why serious backtesting increasingly depends on having access to clean, granular historical data rather than relying on whatever a demo account happens to provide. Traders working across instruments — not just NQ but FX pairs as well — often need to source dedicated historical data packs to get the resolution and time span their testing actually requires.
Why "Two Strategies, So Far" Is a Reasonable Result
There's a temptation in retail algo trading to treat every backtest as a search for the strategy — one system that does everything, works in every session, and never has a losing month. That mindset is exactly backwards, and it's part of why so many EAs collapse the moment they touch live markets.
A disciplined multi-year backtesting process should produce a low hit rate on candidate ideas. If you test dozens of rule variations — different session filters, different breakout thresholds, different exit logic — across seven years of tick data, and only a small handful survive with consistent behavior across regimes, that's not a disappointing outcome. That's the process working correctly. It means the screening was strict enough to filter out noise, overfitting, and regime-specific luck.
This connects to a core backtesting principle worth restating plainly: the more variations you test, the more likely you are to find something that looks good purely by chance. This is sometimes called the multiple comparisons problem, and it's the single biggest reason retail-built EAs that look flawless in a backtest fail in forward testing. A trader who runs one clean idea through seven years of data and finds it holds up is in a very different position than someone who runs five hundred parameter combinations and cherry-picks the best curve. "Two strategies, so far" — phrased with that qualifier, "so far" — suggests an ongoing, skeptical process rather than a one-shot search for a winner. That's the posture worth emulating.
What a Rigorous Validation Process Actually Looks Like
If you're running your own version of this exercise — testing ideas against NQ, another index future, or a basket of FX pairs — there are a few checkpoints that separate a genuinely promising strategy from a backtest that merely looks good on paper.
Out-of-sample testing is non-negotiable. Split your seven years (or whatever window you have) into a development period and a holdout period you don't touch until the rules are locked. If a strategy's edge disappears the moment it hits data it wasn't built on, that's a strong signal the original result was curve-fit to historical noise rather than a persistent market behavior.
Walk-forward analysis catches regime dependence early. Rather than testing once across the full seven-year block, re-run the strategy across rolling windows — say, testing on years one through three, then validating on year four, then rolling forward. A strategy that performs reasonably across most rolling windows is more credible than one that posts a strong aggregate number driven by a single standout period.
Execution assumptions need to match reality. Tick data backtests are only as good as the spread, slippage, and commission model layered on top of them. NQ futures carry their own fee and slippage characteristics that are quite different from spot FX or CFDs; a strategy that looks profitable with zero-slippage assumptions can turn marginal or negative once realistic transaction costs are applied. This is a step that's easy to skip and expensive to skip.
Parameter sensitivity matters as much as the headline result. If a strategy only works with a stop-loss of exactly 42 ticks and falls apart at 40 or 45, that's a red flag for overfitting. Robust strategies tend to perform reasonably across a range of nearby parameter values, not just one precise setting.
Sample size and trade frequency need scrutiny. Seven years sounds like a long time, but if a strategy only generates a handful of trades per year, the total sample size may still be too small to draw confident conclusions about its long-term behavior. A strategy that trades more frequently gives you a statistically richer picture, faster — assuming the frequency doesn't come at the cost of execution quality.
Traders running this kind of process on MT4 or MT5 often hit a practical wall before they even get to the analysis stage: getting the right data into the platform. Tick-level historical data for futures instruments like NQ, or granular FX history, doesn't always import cleanly out of the box. If you're setting up your own testing environment, it's worth working through a proper guide to importing historical data into MetaTrader before you start building — bad imports produce bad backtests regardless of how good your strategy logic is. Traders working in NinjaTrader instead have a parallel import process worth reviewing as well.
Turning a Validated Idea Into an Actual Trading Tool
Finding a strategy that survives seven years of tick-level scrutiny is a meaningful milestone, but it's still a distinct step away from having something deployable. Converting validated logic into an EA that runs reliably on MT4 or MT5 introduces its own set of considerations: how the strategy handles broker-specific spread variation, how it manages open positions across news events, whether it needs session filters to avoid illiquid hours, and how position sizing scales with account size and drawdown tolerance.
This is also where it becomes worth comparing your own build against what's already been tested and packaged by others. Browsing existing Expert Advisor robots built around similar concepts — trend-following, breakout, mean-reversion — can be a useful sanity check on your own assumptions about position sizing, stop placement, and typical trade frequency for a given instrument class, even if you ultimately build your own version from scratch. Seeing how other systems structure risk parameters for an instrument like NQ, or how forex-focused EAs handle spread and slippage differently, can highlight gaps in your own logic before you commit real capital to forward testing.
It's also worth noting that a strategy validated on NQ tick data won't necessarily transfer to other instruments without re-testing. Index futures, individual FX pairs, and commodities each carry different volatility profiles, session liquidity patterns, and news sensitivities. A breakout rule tuned to NQ's pre-market and open-session behavior may behave completely differently on a EUR/USD or gold dataset. If your longer-term goal is a portfolio of uncorrelated systems, each instrument likely needs its own multi-year validation pass — which again comes back to having reliable historical data across asset classes, not just the one you started with.
The Practical Takeaway
The real lesson from "two strategies, so far" isn't about NQ specifically — it's about process. Seven years of tick data, tested with out-of-sample splits, walk-forward checks, realistic execution costs, and honest parameter sensitivity analysis, will naturally produce a small number of survivors. That's not a limitation of the method; it's the method doing its job.
If you're building or testing your own EAs, treat a low hit rate as a sign of rigor, not failure. Before you trust any backtest — your own or one you're evaluating — ask what data it was built on, how many variations were tried before the "winner" emerged, and whether it's been tested on a holdout period it never saw during development. Getting the data pipeline right is the first step: make sure your historical data and import process are solid before you draw any conclusions about strategy performance.