Gold Forecast: How It Was Born
In 2011 I started to read economics and finance books and to experience trading and investment. In 2013 I read a book that has radically changed my way of seeing the monetary and financial situation we are living in.
I started to do more researches individually and then in collaboration with a fantastic team of Italian researchers. What I'm about to show you is the result of one of the finest analyses we have done — one that allows us to invest more consciously in gold and in the precious metal industry.
The Primary Cycle on Gold
The primary cycle on Gold is the 8 year cycle and could really give traders great opportunities to earn money.
Gold ($/oz) logarithmic scale from 1967 to 2017, the 8 years cycle:
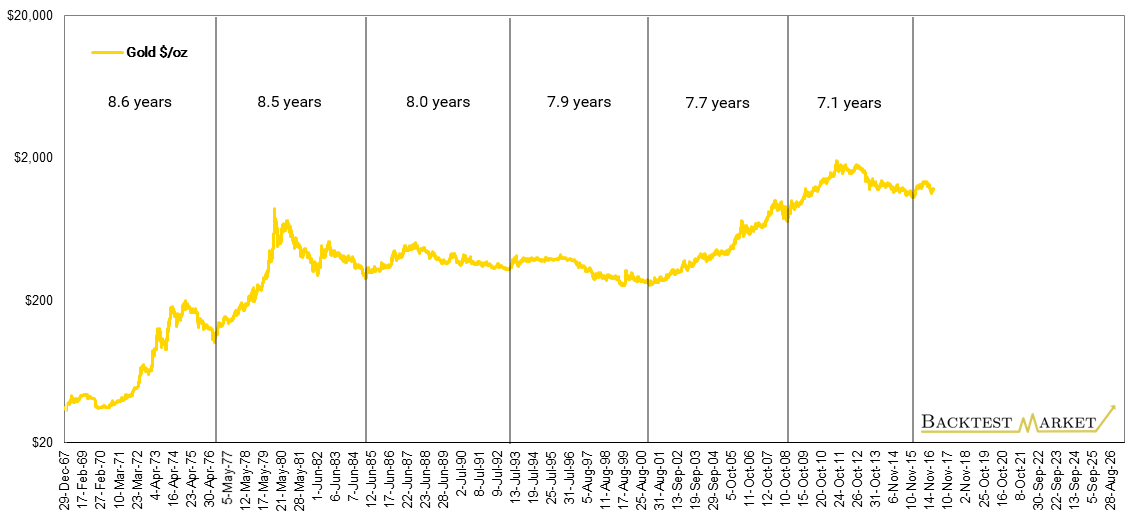
Look that 2 price bottoms where I've plotted vertical lines have not been touched for years and 3 have never been re-tested.
In addition I calculated that the average distance between the cycle's bottoms is 8.1 years and that cycle after cycle the distances are shortening.
December 2015: The Beginning of a New Cycle
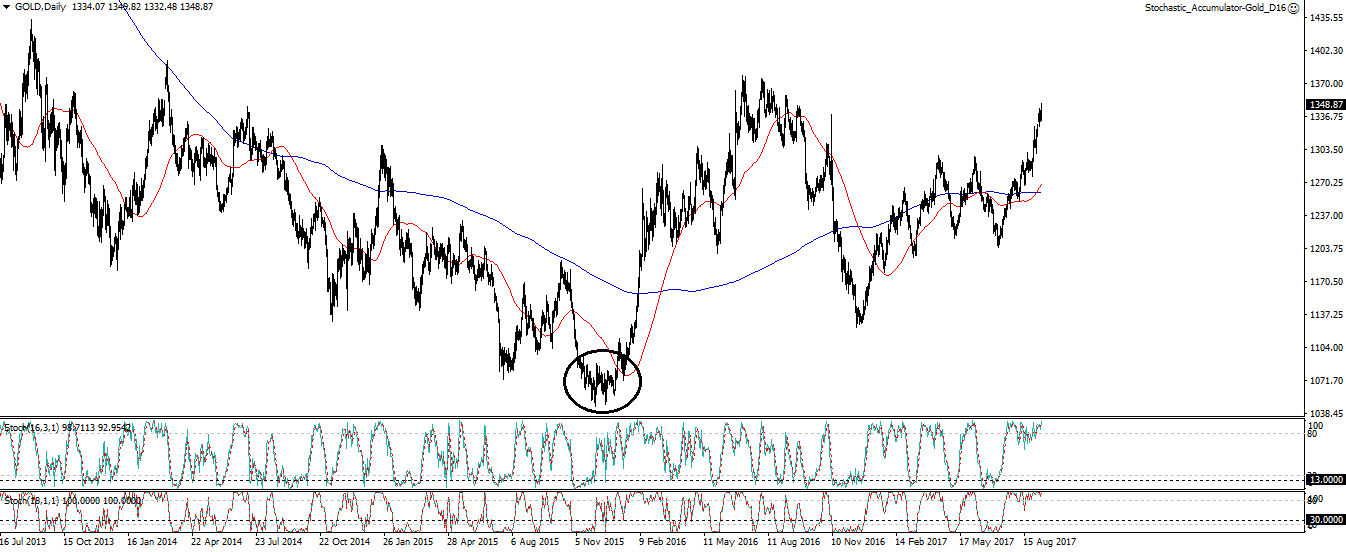
Since December 2015 (the last vertical line) gold is rising and day after day, it is increasingly likely that December 2015 ($1,045) has been the minimum of the eight-year cycle.
The wider cycle of the last 45 years lasted 8 years and 7 months. And if we add the maximum distance (8 years and 7 months) to the previous 13 November 2008 low, the resulting date is 18 June 2017. Now while I'm writing this date has passed for more than 3 months so there are very very high probabilities that we are in a new bullish phase.
To confirm that the actual September 2017 Gold price is $1,348, far from $1,045 8 years cycle low:
Gold Forecast: Time Targets
Each cycle is characterized by the bullish and the bearish phase. So to calculate time targets we'll split each cycle — in the chart below there are the durations in years of bullish and bearish phases:
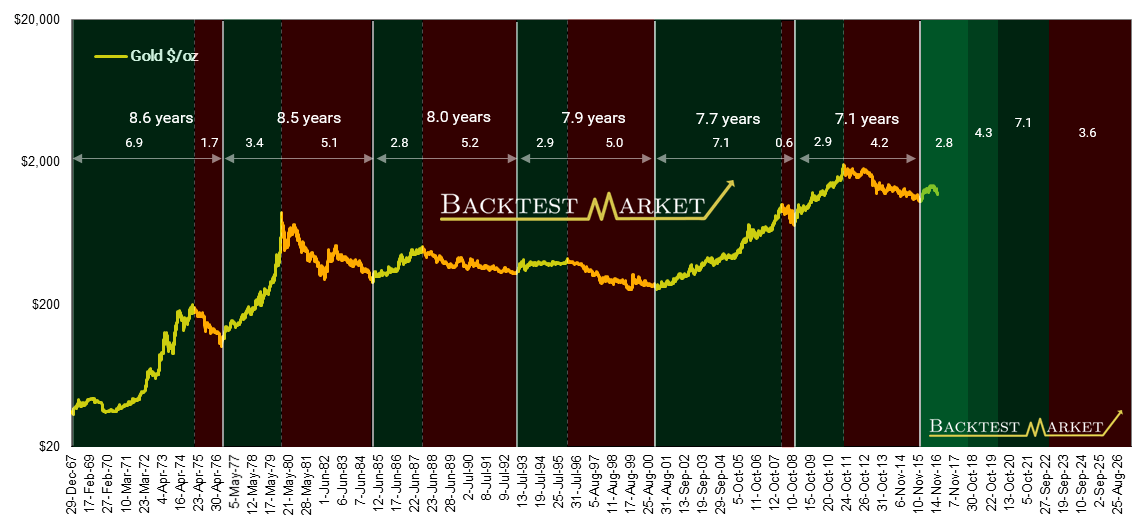
Now to get the gold forecast's time target we just add these durations to 03 December 2015 low date: 2.8 years is the minimum duration, 4.3 years is the average and 7.1 years is the maximum.
When will the next peak of gold most likely occur?
The shorter time target is October 2018, the expected one is April 2020 and the longer one is January 2023. So the most likely is around April 2020.
And I believe that probably that next Gold peak will be a precious metals sector top, like the 1980 one, where we saw almost in the same day Gold, Silver and Copper peaks.
Gold Forecast: Price Targets
Now to forecast the Gold price target we'll measure the performances of the bullish phases: the minimum performance is +28%, the average is +298% and the maximum is +726%.
Gold $/oz Nominal Scale — Price Targets:
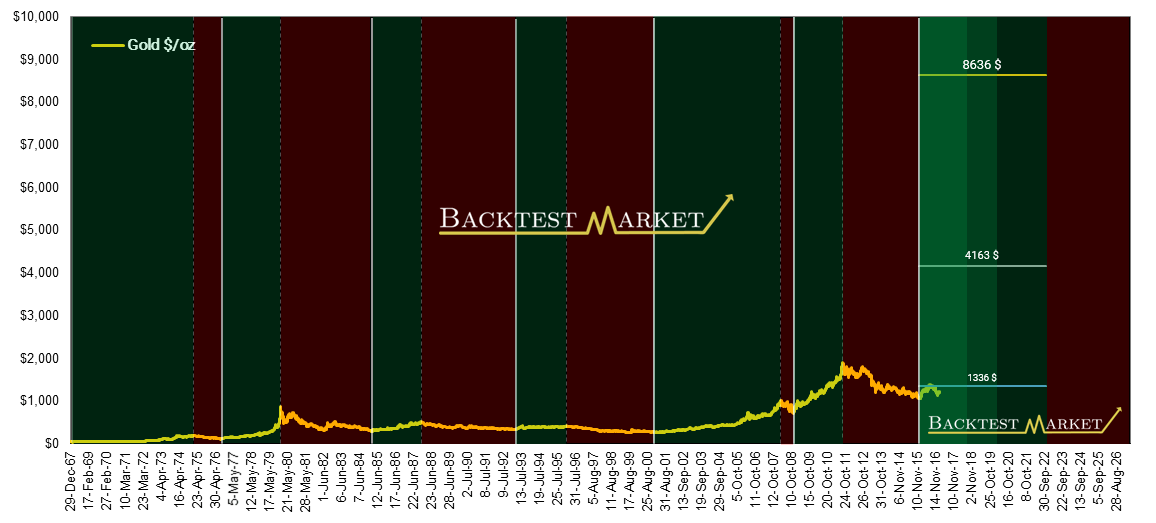
The lowest price target is $1,336, the expected one is $4,163 and the highest one is $8,636. So the most likely price target is around $4,163.
Gold Forecast: Time and Price Targets Summary
| Minimum | Expected | Maximum | |
|---|---|---|---|
| Time | October 2018 | April 2020 | January 2023 |
| Price | $1,336 | $4,163 | $8,636 |
BTM Accumulators Portfolio
Gold Accumulators Logic
The Gold Accumulators Expert Advisors strategies are composed by 2 key points:
- Find a long signal in a bullish trend: To activate the operations the experts first establish with individual conditions if gold is in the bullish phase of the 8 year cycle. And if yes, they wait for a discount price to enter in the best opportunities.
- Risk and trade management: The experts set the stop loss, the take profit and the trailing stop. Each expert will open additional positions when the previous ones have gone free risk (trailing stop > entry price).
More About Risk Management
Stop losses are generally tight relative to the targets and sometimes experts are correlated — so in my portfolio I decided to risk for each operation the 0.5% of the equity.
I noticed that tight stop losses give this strategy the highest profits with the same drawdown, because the average winning trade is about 10 times bigger than the average losing one.
Gold and S&P Seasonal Accumulators
BTM Accumulators Portfolio is composed by 2 strategies:
- Gold Accumulators built on 8 year cycles
- S&P Accumulators built on yearly seasonality
S&P, Dow Jones and every US stock indices have an incredible yearly seasonality. They did historically (from more than 75 years) amazing performances from October to May, instead they had a lateral-bearish trend from June to September.
Accumulators Portfolio equity line:
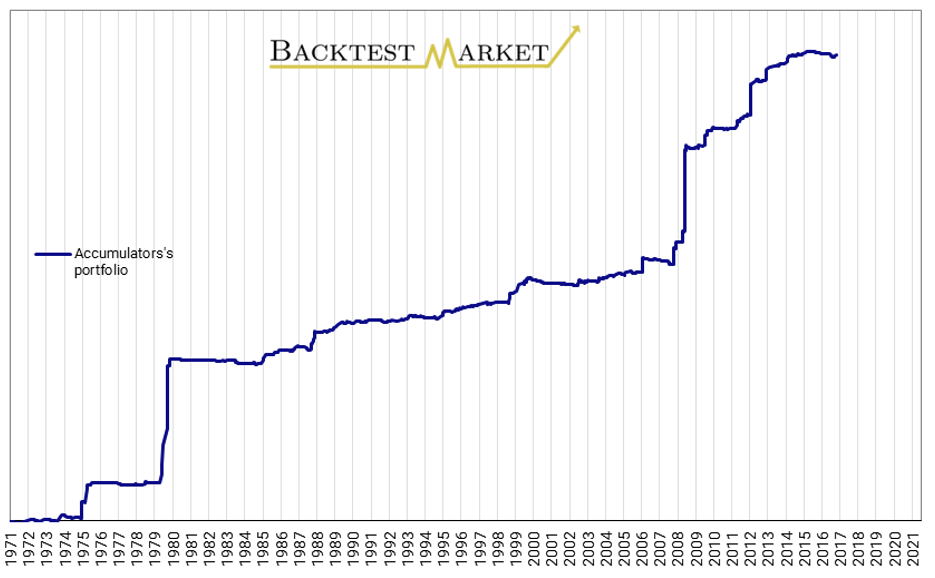
Honestly at the moment I don't have answers to the questions "Why does the 8-year cycle on gold exist?" or "Why do stock indices have such a noticeable yearly seasonality?"
But numbers and statistics show that they exist and provide directions for trading on them. In addition I believe that statistics built on more than 50 years give to Accumulator Portfolio Expert Advisors big chances to continue working well at least in the coming 10 years. And this is enough for me to trade and try to earn well from trading thanks to these indications.
JPMorgan, a gentleman I do not appreciate much but a man of great success, said: "Millionaires do not use astrology, the billionaires do" — maybe the answer is just there, who knows.