

Treat missing bars as explicit gaps: flag them, audit why they happened, and never let a full-sample imputation slide into a backtest unlabeled. The safest default is to exclude gap-dependent signals from your primary results and run any filled-in version as a separate sensitivity case. That keeps your evaluation reproducible and stops silent bias from creeping into strategy performance. The sections below walk through classification, detection, visualization, and treatment in order.
TL;DR:
- Exclude signals dependent on gaps or segment backtests around them to prevent bias and maintain result integrity, especially when gaps are caused by feed outages or holidays.
- Categorize missing bars by mechanism—MCAR, MAR, or MNAR—since each requires a different handling approach, from simple exclusion to model-based imputation.
- Audit missingness by measuring total missing data, identifying patterns, and tracking impact on evaluation windows to assess data reliability before analysis.
- Visualize gaps through timeline plots and heat-maps, and keep contiguous gaps separate because their risk implications can outweigh their raw count.
- Use past-only imputation methods for sensitivity testing and always document imputation choices clearly to avoid look-ahead bias in backtesting.
Table of Contents
- Classifying Missing Bars Before You Touch Them
- What Actually Causes Missing Bars in Market Feeds
- Auditing Missing Bars: What to Measure and How
- Should You Show the Gap or Fill It for the Chart?
- Exclude, Impute, or Test: Choosing a Treatment
- Avoiding Look-Ahead Bias When Bars Are Missing
- Why Clean Source Data Cuts Missing-Bar Risk
- What Years of Chasing Gaps Actually Teaches You
- Getting Data That Rarely Puts You in This Position
- Sources
- FAQ
Classifying Missing Bars Before You Touch Them
Not all gaps are the same problem, and treating them identically is how quiet errors get into a strategy's equity curve. The first split is implicit versus explicit missingness: implicit means the timestamp simply does not exist in your table, while explicit means the row exists but the value is NaN. Materializing implicit gaps into explicit ones, early, is the move that lets you count, plot, and reason about them instead of losing them in a silently shortened index.
The second split comes from the missing-data literature and maps cleanly onto market feeds:
- MCAR (missing completely at random): a rare, isolated dropped tick with no relation to price, volume, or session, close to a coin flip.
- MAR (missing at random, conditional on observed data): gaps that cluster around known low-liquidity windows, like the last hour before a holiday.
- MNAR (missing not at random): gaps tied to the unobserved value itself, such as a feed that drops bars during extreme volatility spikes.
A PMC review of missing-data taxonomies notes that the mechanism should drive the method: MCAR tolerates simple exclusion, MAR often justifies model-based imputation conditioned on the related variable, and MNAR resists most standard fixes because the missingness itself carries information you cannot recover.
What Actually Causes Missing Bars in Market Feeds
Most gaps trace back to one of a handful of causes, and identifying which one you are looking at determines whether you fix the pipeline or adjust your analysis. Legitimate no-trade periods, where an instrument simply did not print because nothing traded, are normal and should not be patched the same way as a defect. As practitioners have pointed out in discussions of exchange feed behavior, a continuous series does not always mean a row every minute.
Common origins include:
- Exchange holidays and session closures, which produce predictable, calendar-aligned gaps.
- Feed outages, where the provider's connection drops for a stretch across many instruments at once.
- Bar-builder errors, where the aggregation logic mishandles a boundary condition and skips a bar.
- Timezone and daylight-saving transitions, which shift session boundaries and can create or duplicate timestamps.
To triage quickly: check whether the gap appears across many instruments at the same timestamp (points to a feed outage), whether it recurs on the same calendar dates each year (points to holidays), or whether it appears only in one instrument's pipeline (points to a bar-builder bug). Cross-referencing provider logs against your own timestamp index resolves most of these in minutes.
Auditing Missing Bars: What to Measure and How
A missing-bar audit needs to answer three questions: how much is missing, where, and in what pattern. Random single-bar gaps scattered across a year behave very differently from one three-hour outage concentrated in a single session, even when the raw percentage looks identical.
A workable audit workflow:
- Detect implicit gaps by scanning the timestamp index for missing slots relative to the expected frequency, the equivalent of
has_gapsorscan_gapsoperations described in the tsibble implicit-missingness vignette. - Materialize the gaps into explicit NA rows with a
fill_gaps-style operation, done before any lag, lead, or rolling-window feature so errors do not propagate silently downstream. - Summarize contiguous-gap lengths into a distribution, since a handful of long gaps usually matters more than many isolated single-bar gaps.
- Report missingness by instrument and by session, not just as one aggregate number, since financial-data research warns that missingness is often systematic rather than randomly distributed.
- Track the percentage of backtest windows touched by any gap, so you know how much of your evaluation period is affected before you draw conclusions.
Every audit report should include per-instrument missingness, session-level missingness, a contiguous-gap-length histogram, and the share of test windows affected. Those four numbers, reviewed together, usually tell you within a few minutes whether a strategy result is trustworthy or an artifact of a bad week of data.
Pro Tip: Automate the first pass with a scheduled job that runs the gap-scan and histogram on every new data pull, so triage starts before a human ever opens the file.
Should You Show the Gap or Fill It for the Chart?
Whether to preserve a gap visually or paper over it depends entirely on what the chart needs to communicate. When temporal continuity matters, such as when a reader needs to see exactly which minutes are missing, materialize the gap and plot it with an explicit time domain so the empty slot stays visible, the approach recommended in the tsibble vignette on implicit missingness. Imputing for display only makes sense in narrow cases, like a dashboard doing categorical comparisons where a filled value is clearly labeled as estimated and never mistaken for an observed print.
A practical set of diagnostic plots covers most audits:
- A missing-per-column bar chart showing the share of missing bars per instrument or feed.
- A NaN co-occurrence heat-map showing which instruments or sessions go missing together, which usually exposes feed-level outages fast.
- A timeline plot with gap shading, so reviewers can see exactly where and how long each gap runs.
Contiguous gaps deserve their own line of scrutiny in any audit, since a financial-data study on missingness notes that gap length overlapping execution windows should drive remediation priority more than raw missing-bar counts. Two instrument-days with the same 2% missing rate can carry very different risk depending on whether that 2% is scattered evenly or concentrated in one three-hour block.
Exclude, Impute, or Test: Choosing a Treatment
Once a gap is classified and measured, the treatment choice narrows quickly. For core backtests, the safe default is to exclude signals and returns that depend on the unresolved interval, or segment the test around the gap entirely. For descriptive analysis, report both the raw series and any imputed version side by side rather than picking one silently.
When imputation is warranted, three recipes cover most cases:
- Past-only last-observation-carry-forward, which never looks past the gap and stays safe for sequential evaluation.
- Rolling-window models fit on past data only, useful when a flat carry-forward would distort volatility-sensitive features.
- Multiple imputation or Bayesian consensus approaches that blend past-only and full-sample posteriors to manage the trade-off between bias and variance, an approach detailed in research on time-series imputation and look-ahead bias.
Each recipe trades bias against variance differently: carry-forward is low-variance but can understate volatility, while full-sample-informed methods reduce variance at the cost of leaking future information into the past.
Sensitivity testing ties the choice together. Run the strategy on the raw, gap-excluded series and again on the imputed version, then compare the metric sets side by side rather than reporting only the version that performs better.

Pro Tip: Keep the original series untouched in storage and generate imputed copies as derived artifacts, so any sensitivity test can be rerun from scratch without re-deriving assumptions.
Avoiding Look-Ahead Bias When Bars Are Missing
The biggest risk with imputed data in a backtest is look-ahead bias: filling a gap using information from after the gap, even indirectly through a full-sample model, lets the strategy "see" data it would not have had in live trading. Research on time-series imputation shows that full-sample imputation methods, however statistically appealing, can contaminate out-of-sample evaluation this way. Past-only imputation, or methods that explicitly separate past-only and full-sample posteriors, avoid this contamination.
A working checklist before any backtest touches imputed data:
- Mark every timestamp that was filled, not just flagged as missing originally.
- Re-run the backtest segmented around gaps as a baseline, before introducing any fill.
- Treat the imputed run as a sensitivity case, never as the headline result.
- Document the imputation method and its assumptions alongside the results, so a reader can judge the trade-off.
Presenting results across all three treatments makes the sensitivity visible rather than buried in a footnote.
| Treatment | Look-ahead risk | Typical use |
|---|---|---|
| Raw, gaps excluded | None | Primary backtest result |
| Imputed, past-only | Low | Sensitivity case, sequential strategies |
| Imputed, full-sample | High | Descriptive analysis only, never primary backtest |
If the imputed-full-sample row shows materially better performance than the raw row, that gap is worth investigating before trusting the strategy.
Why Clean Source Data Cuts Missing-Bar Risk
Most missing-bar triage time goes into figuring out whether a gap is a legitimate no-trade period or a feed defect, work that starts before any modeling. BacktestMarket has offered clean minute-bar historical intraday data across forex, metals, stock indices, bonds, and commodities since 2014, with datasets maintained for direct import into MT4 and MT5. That consistency reduces the amount of gap-classification work an analyst has to do before a dataset is backtest-ready.
Real-time support from the engineers who collect the data means a suspicious gap can be checked against provenance directly, rather than guessed at from logs alone. Careful bar-by-bar verification and documented adjustment history, which the platform states as its own standard, matter most exactly at the moment an analyst is deciding whether a gap is a data defect or a market fact.
What Years of Chasing Gaps Actually Teaches You
My daily order is always the same: a continuity plot first, a gap-length histogram second, then a check of whatever instrument carries the most weight in the portfolio. A gap under a few bars rarely stops a test; a gap spanning a full session almost always does. Send along any unusual case you run into: the strange ones are usually the most instructive.
— Start
Getting Data That Rarely Puts You in This Position
Cleaner source data means fewer gaps to classify in the first place, which is the entire pitch behind BacktestMarket's minute-bar catalog: ready-to-import files for MT4 and MT5, engineer support when a series looks off, and coverage spanning forex, metals, indices, and bonds since 2014.
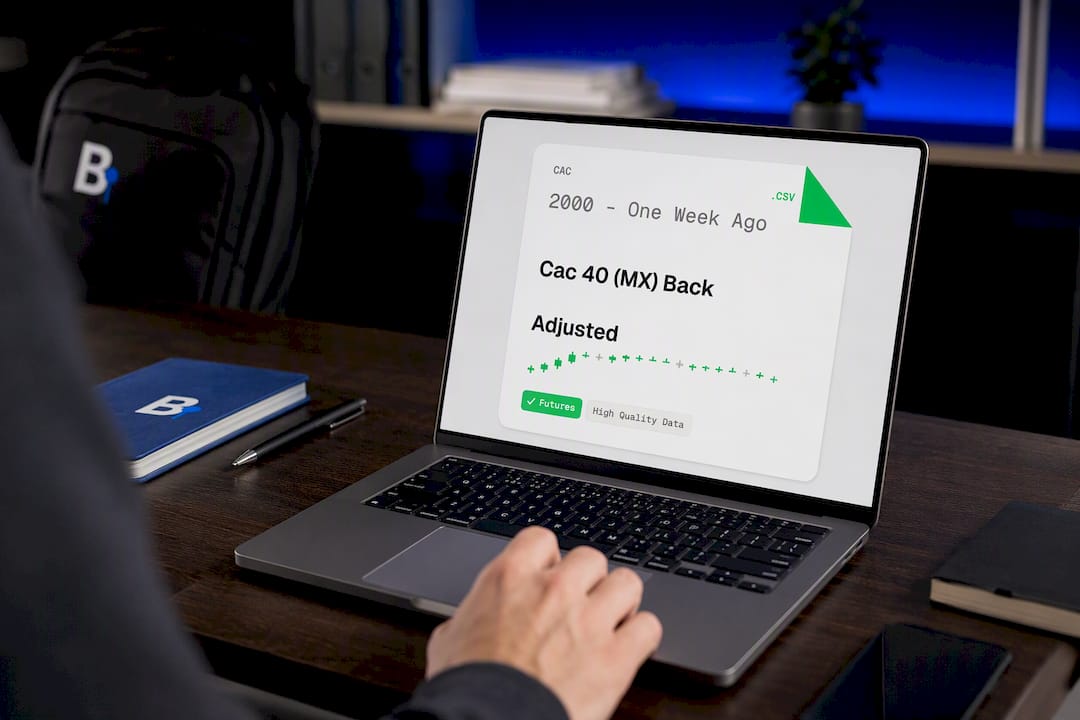
The Cac 40 (MX) Back Adjusted 1mo-back-adjusted-1mo) dataset is one concrete example of a back-adjusted futures series built to import without a manual gap audit first. Browse the full Historical Data catalog or check the Annual Plan at €119 per year for ongoing access alongside the Expert Advisors and Indicators tools.
Sources
- Handle implicit missingness with tsibble
- Time-Series Imputation with Wasserstein Interpolation for Optimal Look-Ahead-Bias and Variance Tradeoff
- Missing Financial Data Article (LBS Research)
- Handling missing data in research - PMC - NIH
For hands-on remediation, see the guides on fixing missing MT4 data, auditing outlier-handled M1 data, holiday gaps in market data, and importing historical data into NinjaTrader.
FAQ
How much missingness is acceptable in a dataset?
There is no universal threshold; acceptability depends on expected closures, bar frequency, overlap with your signals, and reproducibility needs, according to financial-data research on missing bars. Report missingness by instrument, session, and contiguous-gap length rather than relying on one aggregate percentage.
What are some techniques for handling missing data?
Common techniques include exclusion or segmentation around gaps, past-only carry-forward, rolling-window model-based imputation, and multiple imputation or Bayesian consensus methods, as outlined in research on imputation trade-offs and a PMC review of missing-data methods. The right choice depends on the missingness mechanism and whether the result feeds a backtest.
Which technique handles missing values best for backtesting?
For backtests specifically, excluding gap-dependent signals or segmenting the test around the gap is the safest primary approach, since full-sample imputation risks look-ahead bias. Past-only imputation is the preferred fallback when a fill is unavoidable, per work on time-series imputation.
How can users handle missing data day to day?
Start with a continuity plot and a gap-length histogram to see where and how large the gaps are, then classify each gap as a legitimate no-trade period or a feed defect before choosing a fix. Clean, well-provisioned source data, such as datasets maintained for direct import into MT4 and MT5, reduces how often this triage is needed at all.
Recommended
- Audit First MT5 Backtesting Data: Gap, Timestamp, Ready to Import
- Fixing MT4 Missing Data: A Complete Recovery Guide
- How to Achieve 99% Modeling Quality in MT4 for Backtests
Related resources
Explore BacktestMarket's historical data packs to put the ideas in this article into practice.