The Markets Have Seasonalities
I was reading Larry Williams' Long Term Secrets to Short Term Trading when two sentences stopped me:
"A certain day should not be more predisposed than another day to upward or downward trend. The market, however, tells us the opposite: there are in advance better days to buy and better days to sell."
"The use of a simple filter — the TDW (Trading Day of Week) or the TDOM (Trading Day of Month) — allows us to do what scholars say is impossible: beat the market."
My initial reaction was scepticism. Markets move up and down for hundreds of fundamental and technical reasons. The idea that a recurring calendar effect — the simple day number within the month — could be a statistically significant predictor seemed too simple.
Then Williams showed the underlying statistics. I decided, as usual, to run my own research.
Dow Jones: Days of Month Equity Lines
I took Dow Jones data going back to 1900 and created a system to analyse each individual day of the month, from the 1st to the 31st. For each day, the system buys at the open and sells at the close — a pure one-day hold with no other filter.
I expected every day to be approximately neutral. With over 100 years of data and more than 1,200 observations per day, randomness should wash out any pattern.
Instead, the results were immediate and striking — and went beyond what Williams described in the book:
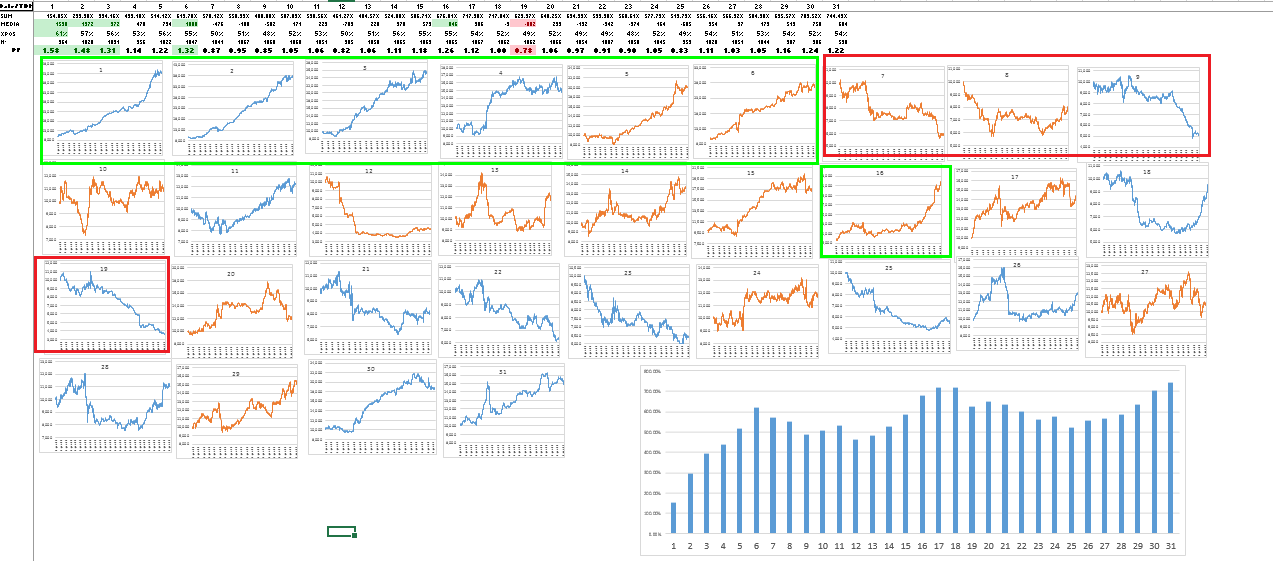
The Dow Jones is historically bullish on the first 6 days of each month, then lateral to bearish on days 7, 8, and 9. Other notable signals appear on the 16th (bullish) and 18th (bullish), and the 19th (bearish). These are not noise — they are consistent effects visible across decades of data.
BTM High Potential Days Trading Systems
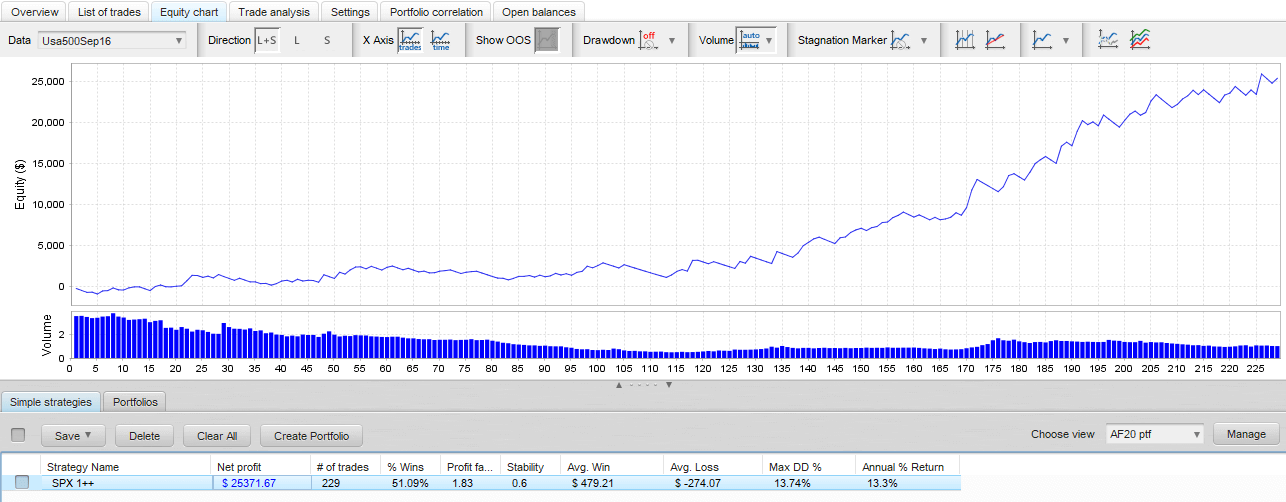
The first High Potential Days Expert Advisor I built trades the S&P 500 long on day 1 of each month — the strongest single-day signal in the dataset:
I do not have a definitive explanation for why these recurring movements occur or what drives the underlying dynamics. What I do know is that the effect is statistically robust across over 100 years of data.
I then extended the analysis to other liquid markets with historical data going back to 1970 or earlier, working in both Excel and MetaTrader. I found over 30 similar evidences. Four of the most compelling:
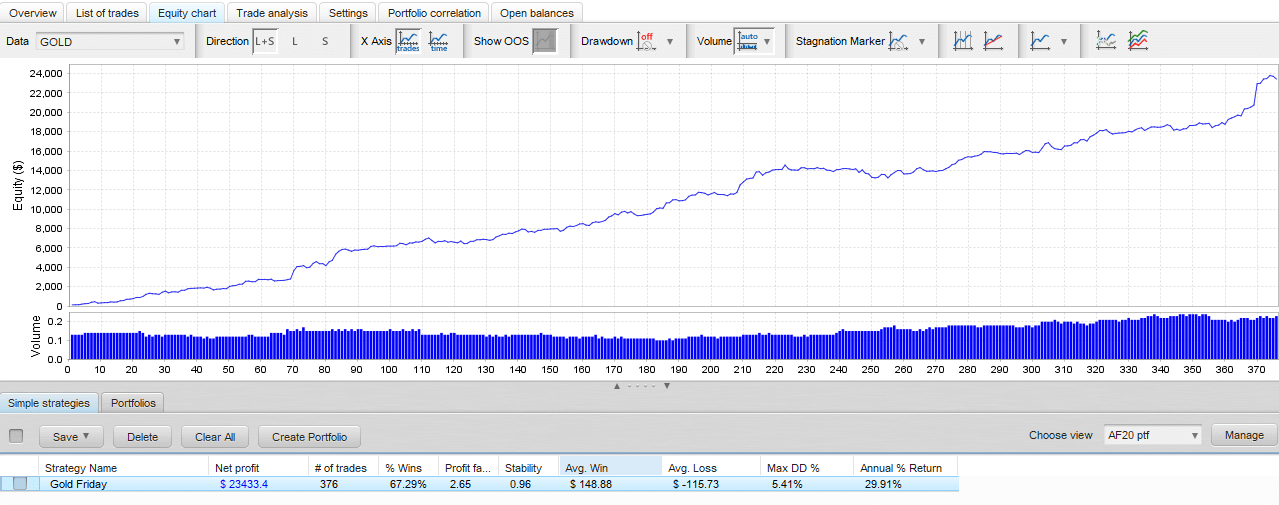
Gold: Fridays
The price of gold tends to rise on Fridays.
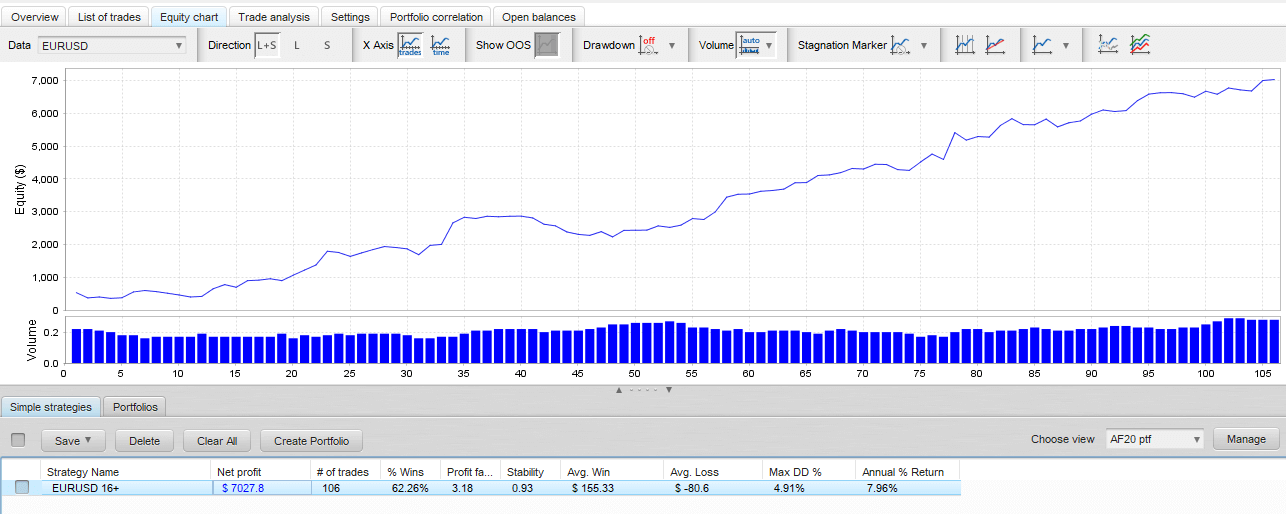
EUR/USD: Day 16 of the Month
The Euro tends to gain versus the US Dollar on the 16th day of each month.
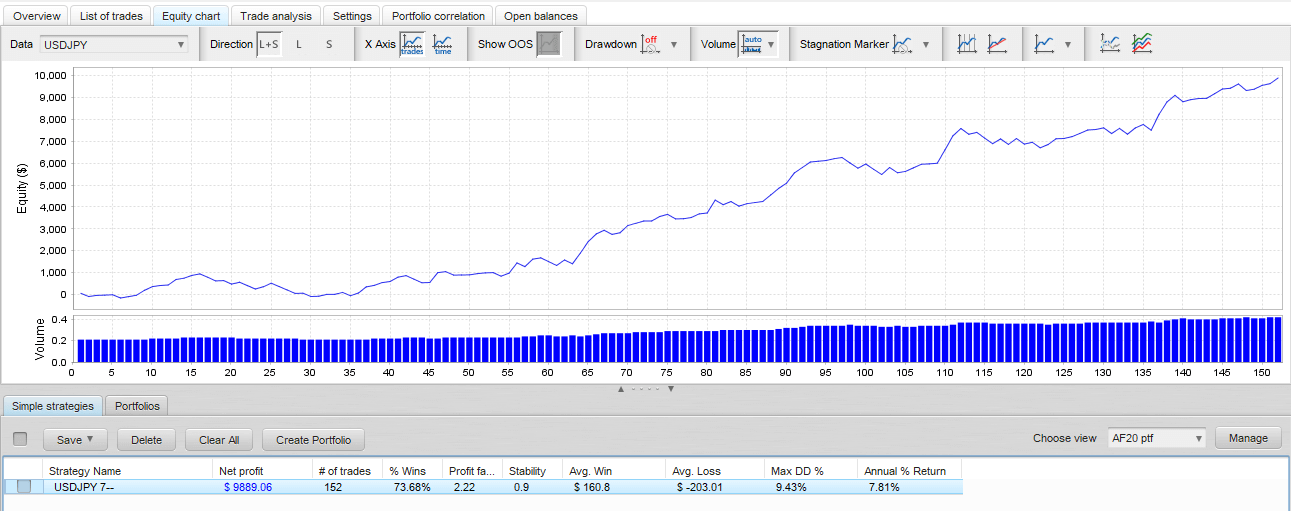
USD/JPY: Day 7 of the Month
The Japanese Yen tends to gain versus the US Dollar on the 7th day of each month.
The HPD Portfolio
These four Expert Advisors — S&P 500 day 1, Gold Friday, EUR/USD day 16, USD/JPY day 7 — are some of the core pillars of the High Potential Days Selected Portfolio, which is itself a core component of the Complete Selected Portfolio.
Each BTM Expert Advisor product page includes a link to download a free demo portfolio containing these four EAs and others from different strategies. The demo versions work in both backtest and live trading with limited contract sizes.
Live trading performance has been consistent with the backtested statistics. The fact that these patterns persist across many decades of data gives a strong statistical foundation for their continued relevance going forward.
I did not expect the data to prove Larry Williams right. Better so — it is one of the more surprising results we have found in systematic market research.