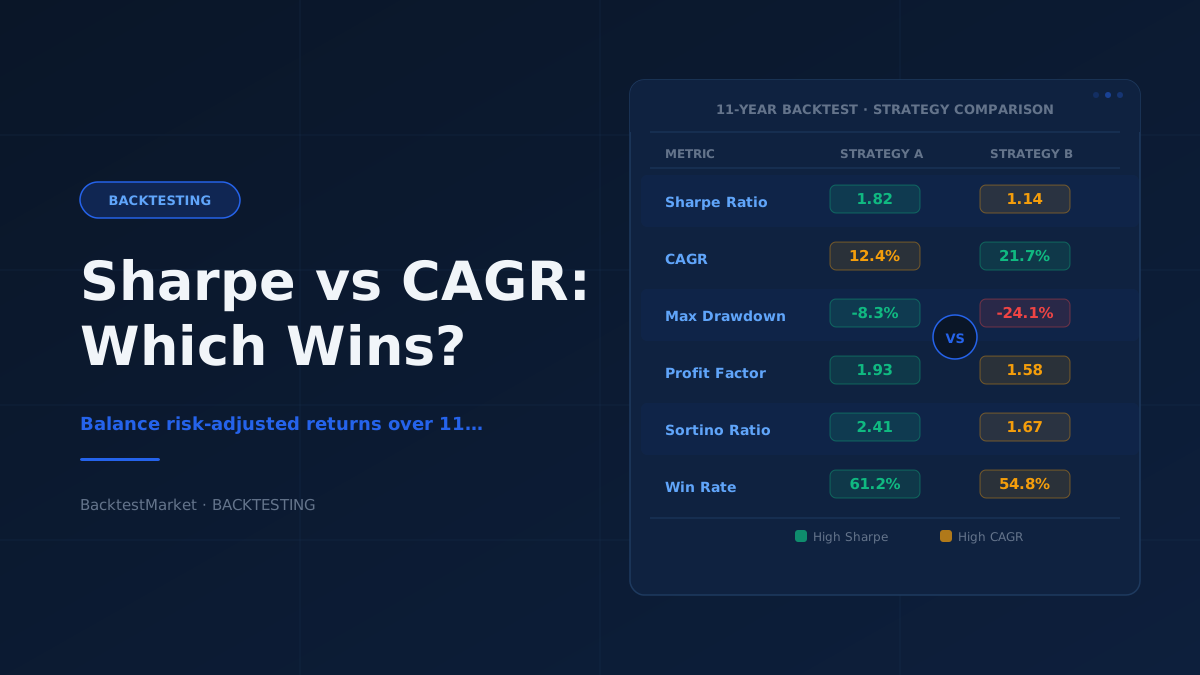
If you've ever run an 11-year backtest on a forex or futures strategy and stared at two competing numbers — a respectable CAGR and a mediocre Sharpe ratio, or vice versa — you'll know the uncomfortable feeling that follows. Which number should you trust more? Which one better predicts how a strategy will actually feel to trade live?
This is one of the most practical questions in algorithmic trading, and it doesn't have a universal answer. What it does have is a structured way of thinking that can guide your decision-making without fooling yourself.
What These Two Metrics Are Actually Measuring
Before you can trade them off intelligently, you need to be precise about what each metric captures — and what it ignores.
CAGR (Compound Annual Growth Rate) measures the smoothed annual growth rate of your equity over the full backtest period. An 11-year backtest gives CAGR a lot of data to work with, which is one reason it becomes more meaningful over longer horizons. A strategy that compounds at a steady rate across different market regimes — pre-2016, post-2020 volatility spikes, the 2022 rate-hiking cycle — is showing genuine robustness. But CAGR tells you nothing about the path that equity took to get there. A strategy can post a strong CAGR while spending three years underwater. Most traders would not survive that psychologically or financially.
Sharpe Ratio measures return per unit of volatility, typically annualised. It rewards consistency. A high Sharpe ratio means your strategy is generating returns without wild swings in either direction. Over an 11-year period, a Sharpe ratio is computed across a large sample of returns, which makes it statistically more reliable than the same metric computed over one or two years. The weakness of Sharpe is that it penalises upside volatility the same as downside volatility — a burst of outsized gains will drag down your Sharpe even if it never hurt you.
The tension between the two is real: strategies optimised for high Sharpe often achieve this by being more selective and trading less, which can suppress CAGR. Strategies with high CAGR often achieve it through aggressive position sizing or catching large but infrequent moves, both of which inflate volatility and compress Sharpe.
The Case for Prioritising Sharpe in a Long Backtest
Over an 11-year window, a case can be made that Sharpe ratio deserves more weight than raw CAGR — particularly for retail traders who are managing their own capital and don't have a risk team or drawdown limits enforced externally.
Here's why:
Drawdown survivability is the hidden variable. A high CAGR strategy that routinely produces 30–40% drawdowns is only valuable to traders who can hold through those drawdowns without margin calls, capital withdrawals, or emotional capitulation. In practice, most retail traders cannot. A strategy with a lower CAGR but a consistently high Sharpe ratio is more likely to be tradeable in reality, not just on paper.
Sharpe correlates with position-sizing headroom. If you want to use leverage, a high Sharpe ratio gives you more room to scale intelligently. You can lever up a 0.8 Sharpe strategy modestly and end up with better risk-adjusted performance than a volatile high-CAGR system that can't tolerate any additional leverage without catastrophic drawdowns.
An 11-year Sharpe has statistical weight. A Sharpe ratio computed on 11 years of daily or weekly returns involves thousands of data points. Unlike a Sharpe computed on 18 months of trades, this figure is far less likely to be a product of a lucky regime. If your strategy maintains a Sharpe above 1.0 across 2015–2026, it has navigated low-volatility grind years, Brexit, COVID, and central bank tightening. That's meaningful.
A practical benchmark worth keeping in mind: a Sharpe ratio above 1.0 over an 11-year period is genuinely difficult to achieve and suggests systematic edge. Above 1.5 is exceptional and worth scrutinising carefully for overfitting. If your Sharpe is sitting between 0.5 and 0.8, you're in the range where the strategy may be real but will require careful position sizing and honest drawdown management.
The Case for Prioritising CAGR — And When It's Valid
There are legitimate scenarios where a lower Sharpe but higher CAGR deserves more weight in your evaluation.
If the drawdowns are short, not just shallow. Maximum drawdown is one dimension; drawdown duration is another. A strategy with a 25% maximum drawdown that recovers in three months is very different from one with a 15% drawdown that takes 18 months to recover. If your backtest shows that periods of elevated volatility (and therefore lower Sharpe) are transient and followed by strong recovery, CAGR may better reflect the long-run opportunity.
If you are combining strategies in a portfolio. When you're running multiple uncorrelated strategies simultaneously — common among serious EA traders — the Sharpe of any individual strategy matters less than the portfolio-level Sharpe. A strategy with a lower Sharpe but returns that are uncorrelated with your other systems may add meaningful diversification value even if its standalone risk-adjusted number looks uninspiring.
If the Sharpe is suppressed by a known and temporary structural feature. For example, a mean-reversion strategy on a currency pair that experienced unusual central bank intervention for a specific 18-month window might show depressed Sharpe for that sub-period. If you can identify and rationalise the anomaly — rather than hand-wave it away — you may be justified in weighting CAGR more heavily and treating the Sharpe dip as non-representative.
The danger here is the tendency to rationalise. Be honest with yourself: are you explaining away a bad Sharpe because you understand the market dynamics, or because you want the high CAGR to be real? The former is analysis; the latter is bias.
A Practical Framework for the Trade-Off Decision
Rather than asking "which metric is better?", build a decision matrix. For an 11-year backtest, consider these four quadrants:
| High Sharpe (>1.0) | Low Sharpe (<0.7) | |
|---|---|---|
| High CAGR | Strong candidate. Scrutinise for overfitting. | Investigate drawdown duration. Can you actually hold it? |
| Low CAGR | Safe but capital-inefficient. Consider leverage or portfolio combination. | Discard or fundamentally rethink. |
When you find yourself in the top-right quadrant — high CAGR, low Sharpe — run the following checks before forward-testing:
-
Segment the backtest. Divide the 11 years into three roughly equal sub-periods and compute both metrics independently. Does the low Sharpe cluster in one sub-period? If the strategy is consistently low-Sharpe across all three periods, the CAGR is coming at a cost you will have to pay in real trading.
-
Examine the monthly return distribution. Sort your monthly returns. If your CAGR is largely driven by five or six outlier months out of 132, the strategy is highly skewed and the Sharpe correctly tells you that the average month doesn't carry much weight. You are effectively betting on infrequent large gains.
-
Stress-test position sizing with the actual drawdown. Using your backtest's maximum drawdown as the input, calculate what happens if that drawdown occurs in year one of live trading rather than year six. Does the strategy survive on a typical retail account? This is a sanity check that CAGR alone will never surface.
-
Use quality historical data. The reliability of both metrics depends entirely on the quality of the price data feeding the backtest. Tick data with accurate spreads and swap rates will produce very different Sharpe and CAGR figures than broker data that is padded or resampled. If you're working with historical data packs that include accurate bid/ask spreads across the full 11-year window, your metrics are far more trustworthy than those produced from free data sources with known gaps or manipulated spikes.
Bringing It Together
There is no formula that tells you exactly where to draw the line between Sharpe and CAGR — but there are principles that make the trade-off explicit rather than instinctive.
For most retail algo traders running a single strategy on a live account, Sharpe deserves more weight because it proxies for psychological survivability and practical drawdown tolerance. A strategy you can actually trade through market stress is worth more than a strategy with impressive CAGR numbers that you abandon after the first bad quarter.
For portfolio-level construction, CAGR relative to correlation with other strategies becomes more important, and standalone Sharpe can be deprioritised.
In both cases, an 11-year backtest is genuinely valuable raw material — provided the underlying data quality supports it. If you're building or evaluating Expert Advisor robots for MetaTrader, understanding these metrics in combination is what separates traders who can evaluate a system critically from those who are simply chasing the highest headline number in the backtest report.
Run both metrics. Interrogate both metrics. Then decide which constraint binds harder given your specific account size, risk tolerance, and whether you're running one strategy or several. That's the trade-off — and making it consciously is one of the most important skills in systematic trading.