

Index data accuracy means your minute-bar price history matches what actually traded, including point-in-time index membership, correct timestamps, and no fabricated or missing bars, at the resolution your strategy actually trades. For a Nifty 50 1m dataset, that means demanding point-in-time membership records, full data provenance, and a written QA pass/fail/warn report before you pay for it. Skip that step and you risk a strategy-specific bias big enough to flip a backtest's entire conclusion.
TL;DR:
- Ensuring minute-bar index data reflects actual trades requires verified point-in-time membership, accurate timestamps, and no missing or fabricated bars; skipping this increases bias risk.
- Survivorship bias, especially in index histories, can distort results for momentum and breakout strategies by misrepresenting past constituent lists and inflating performance metrics.
- Common data defects include phantom spikes, stale or missing bars, mismatched timestamp conventions, and discrepancies between vendor sources, all of which can lead to false trading signals.
- Valid datasets should include detailed provenance, index membership snapshots, and a documented missingness policy, with QA reports and sample spot-checks critical before purchase.
- For strategies needing high precision, only use data with a verified quality assurance process; reconstructed bars may be acceptable for research but not for live trading or performance evaluation.
Table of Contents
- Why Index Data Accuracy Matters for Backtests
- Common Minute-Bar Defects and How to Catch Them
- The Validation Contract: What to Demand Before You Buy
- Running the QA Checks Yourself on a Sample File
- How Backtestmarket Approaches the QA Contract
- When Imperfect Data Is Still Good Enough
- Get a Vetted Nifty 50 1m Dataset
- Primary Resources for Further Validation
- Sources
- FAQ
Why Index Data Accuracy Matters for Backtests
A single mislabeled bar rarely breaks a strategy. A systematic defect, repeated across thousands of bars, can flip your entire conclusion. Survivorship bias is the clearest example: if your Nifty 50 history applies today's 50 constituents retroactively instead of the actual point-in-time membership, you erase every stock that got dropped for poor performance. Your backtest quietly rewards a winning-only universe.
The damage isn't uniform across strategy types. Momentum and breakout systems tend to suffer the worst distortion because they depend on relative strength rankings that survivorship bias directly inflates. Mean-reversion strategies are often more forgiving, though not immune.
Minute-level defects hit differently than daily-level ones:
- A missing bar during a volatility spike can erase the exact tick that would have triggered your stop.
- A phantom high or low can trigger a stop-loss that never should have fired, or mask one that should have.
- Stale bars flatten your realized volatility estimate, which throws off position sizing for any strategy using ATR or standard deviation.
Picture a momentum strategy ranking Nifty 50 stocks by 20-day return. If a constituent that was removed from the index in 2019 gets included by mistake, its historical returns leak into a ranking window where it never actually belonged. The signal generated that day is not one a live trader could have seen.
Common Minute-Bar Defects and How to Catch Them
Four defect types account for most of the divergence between vendor datasets, and Concretum Group's testing found the same opening-range-breakout backtest produced results differing by up to threefold across providers once you factor these in. Significant performance differences can appear.
- Phantom highs and lows. A wick that spikes far beyond the surrounding price action, often with no matching volume, usually signals a data error rather than a real trade. Concretum's detection recipe uses three parameterized z-scores, one for the bar's body relative to neighbors, one for the wick length, and one for volume coherence, to flag candidates for review.
- Stale bars and missing bars. Compare your row count against the expected number of slots for that session, using the exchange's actual calendar. A Nifty 50 1m file that shows 375 bars for a normal trading day but only 340 for a day with no listed holiday is hiding something. Repeated identical closes across consecutive bars is another giveaway of a stale feed rather than a quiet market.
- Early-close leakage and timestamp conventions. Some vendors label a bar by its opening second, others by its closing second. Mixing conventions inside one file creates a one-minute leak that lets a strategy "see" a price before it existed. Check whether your provider's labeling matches its documentation, and test it directly against a known early-close session.
- Tick-to-bar assignment and venue coverage. Two vendors sourcing from different feeds can each build technically correct bars that disagree at the second decimal, and on threshold-based strategies that difference is enough to flip a trade direction on a measurable share of trading days, per Concretum's cross-provider testing.
Pro Tip: Don't tune your phantom-detection thresholds once and forget them. Sample twenty flagged bars by hand every time you onboard a new dataset; the right z-score cutoff for a low-volatility index differs from the right cutoff for a high-beta one.
The Validation Contract: What to Demand Before You Buy
Treat every historical dataset purchase like a contract with deliverables, not a download link. A dataset can look clean in a spreadsheet and still be unusable for an investable backtest, which is why a documented research contract, covering universe definition, timestamp convention, and price basis, has to exist before you trust anything downstream, as DailyBulls argues in its data QA framework.
Here's the minimum a seller should hand you:
- Point-in-time membership snapshots. Not just current constituents, but a dated record of every addition and removal, checked against known index events like rebalances.
- Provenance fields. At minimum,
source_file,run_id,source_timestamp, and araw_sha256checksum on the raw feed, plus a documented log of every corporate-action adjustment applied. These lineage columns are what make a dataset auditable rather than a "trust me" CSV, a point DailyBulls' pipeline guide makes directly. - Session and timezone documentation. Which calendar governs holidays, what timezone timestamps use, and whether labeling is start-of-bar or end-of-bar.
- An explicit missingness policy. Does the vendor fill gaps, flag them, or leave them out entirely? Silent filling is the one answer you should never accept without an audit flag.
Statistic Callout: Concretum's own cross-provider tests found trade-direction divergence on a small percentage of days for certain threshold strategies, purely from differences in how vendors constructed bars from raw ticks. Two percent sounds small until it's the two percent that decided your Sharpe ratio.
The deliverable you want at the end is a QA report scored pass, fail, or warn on each check, plus a sample spot-check CSV for something like Nifty 50 1m that includes lineage columns you can trace back to source.
Running the QA Checks Yourself on a Sample File
You don't need a full engineering team to stress-test a sample before committing to a purchase. Run these checks on whatever sample CSV a vendor sends you.
- Row-count test. Pull the exchange's session calendar and compute the expected number of one-minute slots per day. Compare that against your actual row count for a two-week sample. Any day that's short by more than a handful of bars needs an explanation.
- Phantom-spike audit. Apply the z-score defaults from Concretum's detection framework, then manually eyeball the top twenty flagged bars against a chart. Reconstruction formulas exist to replace an extreme wick while preserving the bar's body, but any reconstructed bar must carry a visible flag. An unlabeled fix is worse than a labeled gap for most intraday strategies.
- Point-in-time membership rebuild. Tools like the nsepit project reconstruct historical Nifty 50 membership from bhavcopy archives and include a bias harness that runs the same toy strategy twice, once with true point-in-time membership and once with today's constituents applied retroactively, then prints the delta. Run that delta before you trust any ranking-based backtest.
- Early-close and tick-boundary tests. Isolate a known early-close session and confirm your bars actually stop at the right time. If the last bar of the day runs long or short relative to documentation, refuse the dataset until the vendor explains the mismatch.
Pro Tip: If a vendor can't produce a QA report or explain their missingness policy in writing, treat that silence as your answer. A dataset without documented provenance is a liability, not a bargain.
How Backtestmarket Approaches the QA Contract
Backtestmarket has published clean minute-bar histories, including a dedicated Nifty 50 1m dataset, since 2014, formatted for direct import into MT4 and MT5 without reformatting.
- Datasets ship with documented provenance and adjustment notes rather than an unlabeled static file.
- Support comes directly from the engineers who build the pipelines, not a generic help desk, so spot-check questions get answered by someone who actually knows the data.
- Blog resources like the guide to auditing MT5 backtesting data walk through gap and timestamp checks that mirror much of the QA contract above.
Ask any vendor, Backtestmarket included, for named case studies and specific accuracy figures before treating a claim as verified.
When Imperfect Data Is Still Good Enough
Not every strategy needs the same standard of minute-level perfection. A long-horizon trend system that rebalances monthly can usually tolerate a handful of missing minute bars scattered across a decade; the signal survives the noise. An intraday breakout system, or anything with a hard stop-loss triggered by a single wick, cannot. For those, one phantom high in the wrong five minutes can manufacture a loss that never happened.
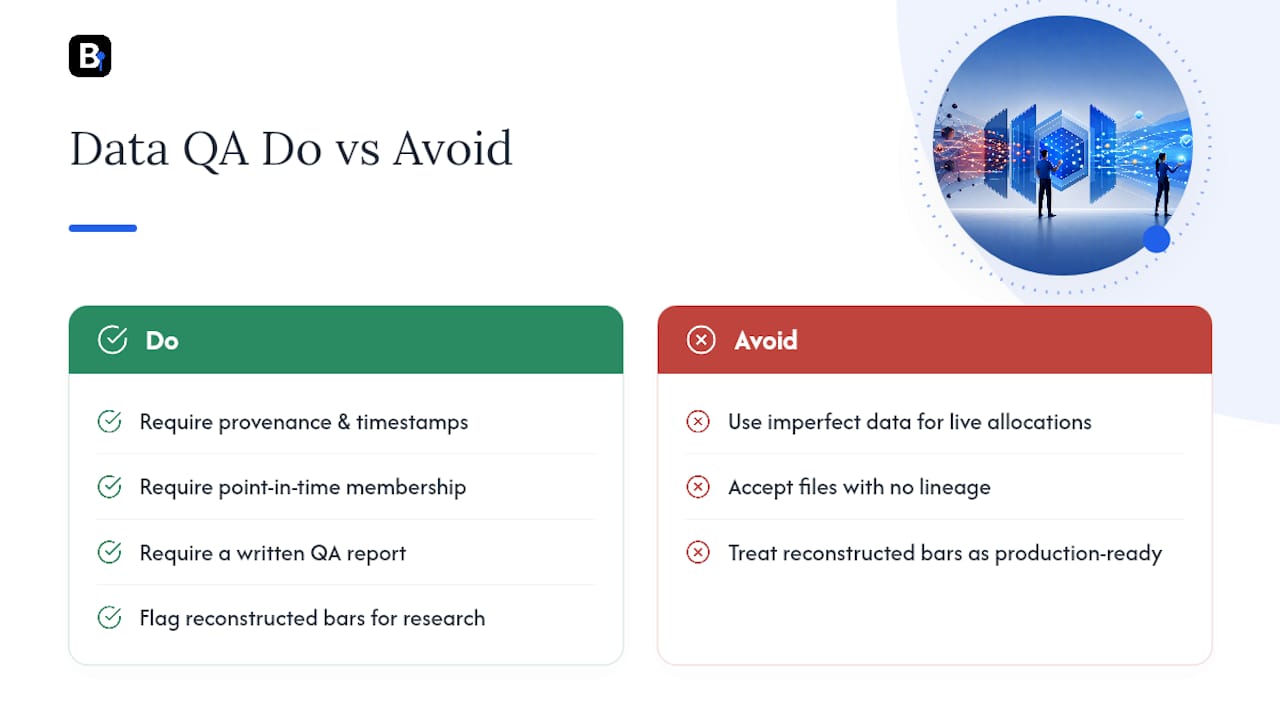
The operational rule I'd apply: if the backtest result is going in front of an investment committee or feeding live capital, require provenance, point-in-time membership, and a written QA report, full stop. Reconstructed bars are fine for exploratory research, provided every reconstruction carries an audit flag. What you never want is a clean-looking file with no lineage and no way to check its own history.
— Start
Get a Vetted Nifty 50 1m Dataset
Backtestmarket sells complete, clean minute-bar histories as a one-time download, not a subscription you have to keep justifying, and the Nifty 50 1m product ships ready to import straight into MT4 or MT5 without reformatting.
Before you buy from anyone, request a sample CSV with provenance columns intact, ask for the QA report, and spot-check a handful of known index events yourself. If you need broader coverage across asset classes, the historical data catalog covers forex, metals, and commodities alongside indices, and the Annual Plan at €119 per year suits traders who need recurring access rather than a single dataset. Traders building automated systems around the data can also look at the site's Expert Advisors and indicators. Start with a sample request, run the row-count and phantom-spike checks yourself, and decide from there.
Primary Resources for Further Validation
For deeper detection methodology, Concretum Group's guides cover phantom-bar and stale-bar diagnostics in detail. The nsepit package handles point-in-time membership rebuilds and survivorship bias harnesses for Nifty-style indices. DailyBulls' pipeline-building guide covers canonicalization practices worth applying to any NSE-linked dataset.
Sources
- How to Detect and Fix Problems in Intraday Market Data - Concretum Group
- nsepit (point-in-time reconstruction and bias harness) - GitHub
FAQ
What Does "Index Data Accuracy" Actually Cover?
It covers whether minute-bar index prices match what actually traded, including correct point-in-time constituent membership, accurate timestamps, and no missing or fabricated bars.
How Do I Check for Survivorship Bias in Nifty 50 Data?
Run the same strategy twice using the same price history, once with true historical membership and once with today's constituents applied retroactively, then compare the results; tools like nsepit automate this comparison.
What's a Phantom High or Low?
It's a wick in a price bar that spikes well beyond surrounding price action, usually with no supporting volume, and it typically signals a data construction error rather than a real trade.
Does Backtestmarket's Nifty 50 Data Include Provenance Documentation?
Yes, Backtestmarket's Nifty 50 1m dataset ships with documented adjustments and is formatted for direct MT4/MT5 import; ask the team for the current QA report and sample spot-checks.
Should I Ever Accept a Dataset With Missing Bars?
Only for strategies tolerant of gaps, like slower-moving trend systems, and only if the missingness is disclosed rather than silently filled; intraday and stop-based strategies need near-complete minute continuity.
Recommended
- Audit First MT5 Backtesting Data: Gap, Timestamp, Ready to Import
- 5 Audits Quants Must Run on Outlier Handled M1 Data Before MT4/MT5
- Minute Bar Data: What Quants Need for Reliable Backtests
- Fixing MT4 Missing Data: A Complete Recovery Guide
Related resources
Explore BacktestMarket's Expert Advisor robots to put the ideas in this article into practice.