

Intraday correlation data are time-stamped correlations between asset returns calculated on sub-daily bars, usually 1 second to 5 minutes apart. The core empirical finding is that these correlations are not stable: they typically climb through the trading session and spike around news, which means risk models built on daily correlation alone underestimate how exposed a portfolio gets by 3 p.m.
TL;DR:
- Intraday correlations tend to increase during the trading day, especially around news, making risk models based only on daily data underestimate exposure after midday.
- The choice of sampling frequency, from tick data to 5-minute bars, significantly affects correlation estimates, with higher frequency data capturing more noise and requiring specialized estimators.
- Correlation patterns shift rapidly at macroeconomic news releases, turning stable regimes into highly correlated markets within minutes, emphasizing the need for frequent monitoring.
- Proper preprocessing steps, including timestamp alignment to UTC and handling missing data, are critical to obtaining accurate correlation estimates and avoiding misleading artifacts.
- Ready-to-use intraday datasets formatted for platforms like MT4 and MT5 eliminate much of the preprocessing workload and improve the reliability of intraday correlation analysis.
Table of Contents
- What Counts as Intraday Correlation Data
- What the Data Actually Show Through the Trading Day
- Choosing an Estimator: Score-Driven, DCC, or Robust Methods
- A Preprocessing Checklist for Trustworthy Correlation Estimates
- Putting Correlation Data to Work: Risk, Hedging, and Rebalancing
- How BacktestMarket Removes the Friction From This Workflow
- A Quant's Take: When the Correlation Regime Flips Mid-Session
- Get Clean Intraday Data Without the Pipeline Work
- Sources
- FAQ
What Counts as Intraday Correlation Data
Intraday correlation data cover any pairwise or multivariate correlation estimate computed from returns sampled within a single trading session rather than across daily closes. The building blocks are OHLCV bars aggregated at fixed intervals, tick-by-tick trade prints, or quote midpoints, and the choice among them changes what the correlation number actually measures.
Most workflows compute log returns from consecutive bar closes, then estimate correlation over a rolling window. Timestamp conventions matter more than people expect: a "5-minute bar" can be labeled by its open or its close, and mismatched conventions between two data feeds silently corrupt an entire correlation matrix. Practical guides on intraday data structure recommend normalizing timestamps to UTC and treating session gaps explicitly rather than letting them default to zero returns.
Resolution choice comes with real trade-offs:
- Tick data captures every trade but carries heavy microstructure noise and requires asynchronicity handling.
- 1-second bars preserve most of the intraday signal but need specialized estimators to avoid bias.
- 1-minute bars balance noise and volume well for most equity and FX pairs.
- 5-minute bars smooth out noise almost entirely but can blur fast-moving correlation shifts around news.
There is no universally correct frequency. The right choice depends on the estimator downstream and how much noise your assets actually generate at that sampling rate.
What the Data Actually Show Through the Trading Day
Correlations rarely sit still during a session. Empirical work on NYSE and other exchanges finds a recognizable shape: correlations start low near the open, rise steeply through the morning, keep climbing into the afternoon, and then diverge at the close depending on which estimator you use.
The pattern in numbers: studies using sampling from 15 minutes down to 1 second consistently find that the market's first eigenvalue, the dominant common factor, grows over the course of the session. A rising first eigenvalue means stocks increasingly move together as the day progresses, which erodes intraday diversification exactly when many desks assume it still holds.
A few structural shifts are worth tracking on top of the daily shape:
- Pairwise correlations at 5-minute frequency often trace an inverted U-shape across the session rather than a simple monotonic rise.
- Lead-lag contributions to the correlation structure have shrunk over the past two decades, while synchronous correlation has grown, a sign that stat-arb strategies relying on stale lead-lag relationships have less room to work.
- Correlations are highly sensitive to scheduled news and to the overlap of trading sessions across time zones, a dynamic worth checking against a global market hours reference when you are trading instruments across venues.
Whether a high or low correlation reading is "good" depends entirely on context: low correlation supports diversification, but a sudden jump toward one usually signals systemic stress, the exact moment diversification benefits disappear.
Choosing an Estimator: Score-Driven, DCC, or Robust Methods

Picking a model is really about matching the estimator to your sampling frequency, not picking a "best" method in the abstract.
At ultra-high frequency (1 second and below), naive correlation estimators break down because trades across assets rarely land on the same timestamp. Score-driven, local-level models treat this asynchronicity as a missing-data problem rather than trying to interpolate it away, and this approach has been shown to reduce bias from microstructure noise while still enabling live nowcasting of correlation changes.
For moderate frequencies, adapted multivariate GARCH frameworks remain the workhorse:
- DCC (dynamic conditional correlation) models pairwise correlation evolution and works reasonably well once adapted for intraday diurnal patterns.
- DECO simplifies DCC by assuming equal correlation across all pairs at a point in time, useful for large baskets where estimating a full matrix is impractical.
- Both have been fit successfully at 5-minute frequency on equity index data, with fit quality improving once the model accounts for the inverted U-shape rather than assuming a flat correlation.
When noise dominates the signal, robust estimators like the subsampled quadrant estimator can recover more consistent correlation and beta estimates than classical Pearson correlation on the same high-frequency data.
Pro Tip: Run a quick signal-to-noise check before committing to an estimator. If your per-interval SNR sits below 1 at your target sampling rate, either widen the interval or switch to a missing-value/local-level model instead of forcing a classical estimator to work.
A Preprocessing Checklist for Trustworthy Correlation Estimates
Bad inputs produce confident-looking, wrong correlation matrices. Before trusting any output, work through these steps in order:
- Align every feed to UTC and fix a single convention for whether a bar's timestamp marks its open or its close.
- Handle missing data deliberately. Use a missing-value model or refresh-time sampling rather than naive previous-tick interpolation, which introduces artificial smoothing at ultra-high frequency.
- Reduce noise before estimating. Subsampling, robust estimators, or a local-level model that separates noise variance from signal variance all outperform raw tick-level Pearson correlation.
- Adjust futures data for contract rolls and correct equities for splits and dividends; an unadjusted roll can create a fake correlation break that has nothing to do with market behavior.
- Run a correlation signature plot across multiple sampling frequencies and confirm the estimate stabilizes rather than drifting as you change the interval.
Exchange-specific quirks compound all of this. Daylight saving time transitions alone can shift a whole session's timestamps by an hour if a feed doesn't handle the switch correctly, an issue detailed in BacktestMarket's guide to fixing DST errors in minute data.
Pro Tip: Back-adjusting futures and aligning timestamps to UTC are not optional cleanup steps for multi-venue correlation work. Skip either one and your correlation matrix will reflect data artifacts as often as real market behavior.
Putting Correlation Data to Work: Risk, Hedging, and Rebalancing
Intraday correlation only earns its keep when it changes a decision. A few recipes show how quant desks actually use it.
Intraday beta. Decompose log beta into log correlation plus log relative volatility over a rolling window, say 60 minutes, and you can see immediately whether a beta shift comes from a correlation change or a volatility change. That distinction changes what you hedge against.
- Use local correlation combined with relative volatility to update hedge ratios intraday rather than relying on a static daily beta.
- Tie dynamic exposure scaling to first-eigenvalue growth: as the market factor strengthens through the session, cut position sizing on correlated names before a broad selloff forces the issue.
- Set explicit correlation thresholds that trigger a review of hedge windows, particularly around scheduled announcements or session overlaps.
Backtesting any of this needs discipline. Simulate execution against realistic slippage and transaction costs, and require end-of-day liquidation rules to avoid smuggling overnight risk into what's supposed to be a pure intraday signal. Lookahead bias is the silent killer here: if your correlation window includes bars that wouldn't have been available at decision time, your backtest is measuring nothing real.
How BacktestMarket Removes the Friction From This Workflow
Most of the work described above, timestamp alignment, missing-value handling, roll adjustment, is unavoidable when you build a correlation pipeline from scratch. Clean source data cuts that work down significantly.
- BacktestMarket has provided clean minute-bar historical intraday data since 2014, which removes a large share of the preprocessing steps covered in the checklist above.
- Datasets import directly into MT4 and MT5, which sidesteps the timestamp misalignment that creeps in when you're stitching together feeds from multiple vendors.
- Engineer-staffed support and technical posts, including the Nasdaq intraday data specs guide, address exchange-specific quirks like DST transitions before they ever reach your correlation matrix.
To start a 1-minute correlation workflow, pull matched minute-bar sets across the instruments you're comparing, confirm they share a UTC-aligned timestamp convention, then run your estimator of choice on the aligned series.
A Quant's Take: When the Correlation Regime Flips Mid-Session
The lesson that sticks with practitioners isn't the diurnal shape itself. It's how fast a quiet morning correlation regime can flip once a macro print hits, turning a well-hedged book into a directional bet within minutes. Desks that only check correlation once at the daily close find out about the flip after it already cost them.
The fix isn't a smarter model, but checking correlation as often as you check price.
— Start
Get Clean Intraday Data Without the Pipeline Work
Datasets are offered as complete, ready-to-import minute-bar datasets across forex, metals, stock indices, bonds, and commodities, designed to reduce the need for timestamp cleanup, roll adjustment, and missing-data handling covered earlier in this guide.
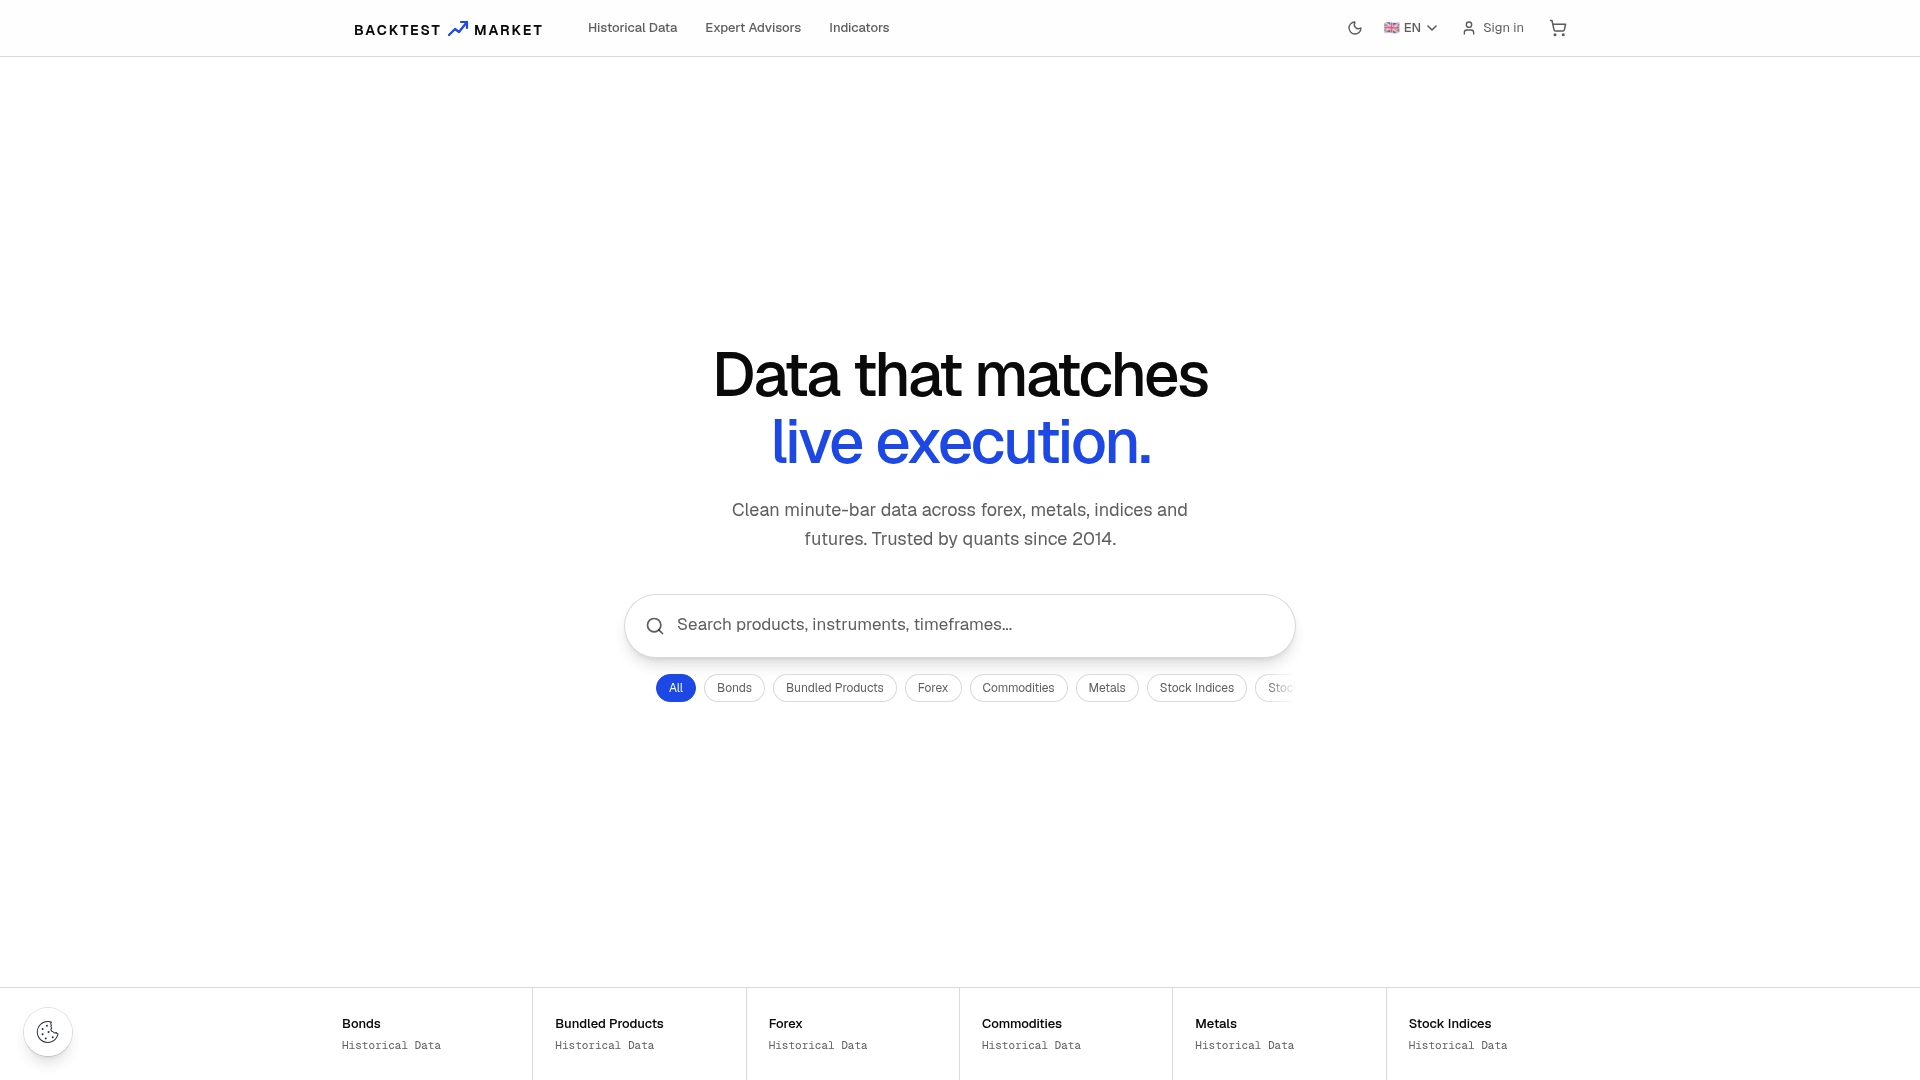
Datasets come as all-in-one downloads formatted for direct import into MT4 and MT5, including back-adjusted futures packages for traders who need continuous contract series without doing the roll math themselves. That matters most for anyone running the intraday beta or hedging recipes above across multiple asset classes, where mismatched bar conventions between feeds are the single most common source of a broken correlation matrix. Fixed-income traders working with rate products can start with the 30-year Treasury bond 5-minute dataset, while FX desks can browse the full forex historical data catalog for pairs to build a correlation matrix around. If you're setting up in NinjaTrader, the data import walkthrough gets a dataset running in your platform the same day you download it.
Sources
For deeper methodology, the OFR lead-lag paper covers historical shifts in synchronous correlation, the ACFR multivariate GARCH paper details DCC/DECO adaptations, and the score-driven local-level preprint addresses asynchronicity at ultra-high frequency. For engineering basics, see the intraday data explainer.
- How Lead-Lag Correlations Affect the Intraday Pattern of Collective Stock Dynamics
- A score-driven conditional correlation model for noisy and asynchronous data (accepted manuscript)
- Modelling intraday correlations using multivariate GARCH (ACFR technical paper)
- Robust correlation estimators for high-frequency financial data (technical manuscript)
- Intraday stock data explained: what it is, how it works and how to use it for charts, alerts and backtesting
FAQ
What Does Intraday Data Mean?
Intraday data are price or return observations recorded at sub-daily intervals, typically ranging from tick-level trades to 1-minute or 5-minute bars, rather than a single daily close.
What Is the 3-5-7 Rule for Day Trading?
The 3-5-7 rule is a position-sizing guideline suggesting no single trade risk more than 3% of capital and total exposure across all open trades stay under 5%; it's a risk heuristic, not a correlation or statistical model.
Is High or Low Correlation Better?
Neither is inherently better: low correlation supports diversification benefits, while a rising correlation, especially a jump in the market's first eigenvalue, often signals systemic stress where diversification stops working.
Where Can I Find Intraday Stock Data?
Clean, ready-to-import intraday datasets are available through providers like BacktestMarket, which offers minute-bar historical data across forex, indices, metals, and bonds formatted for direct use in MT4 and MT5.
Recommended
- Data Snooping Bias: How Researchers and Quants Catch It
- Forex Daylight Saving Time: Fixing DST Errors in Minute Data
- 5 Audits Quants Must Run on Outlier Handled M1 Data Before MT4/MT5
- Minute Bar Data: What Quants Need for Reliable Backtests
Related resources
Explore BacktestMarket's Expert Advisor robots to put the ideas in this article into practice.