

Exchange archives like NYSE Daily TAQ stretch back to 1993, commercial vendors routinely sell 10 to 25 years of minute-bar data, and most charting platforms cap you at a fixed bar count rather than a calendar span. That last part trips up more quants than anything else: a "20,000 bar" limit on a 1-minute chart covers barely three months of continuous US trading hours, not the multi-year window most backtests need. Before you commit to a strategy timeline, know which kind of limit you're actually up against.
TL;DR:
- Commercial vendors generally offer up to 25 years of intraday data, but coverage gaps and inconsistent adjustments require verification before purchase.
- A 20,000-bar cap on a 1-minute chart limits you to roughly 10 weeks of trading history, making multi-year backtesting impossible within native platform limits.
- Longer histories are more available for equities and futures, while options, FX, and crypto data tend to be shorter, less complete, or have quality gaps.
- Downloaded datasets already cleaned and sessionized can save time and improve backtest reliability over raw platform exports or archives.
- For strategies demanding multi-year tick or minute data, expect to manage large storage needs or rely on vendor-provided archives with clear adjustment documentation.
Table of Contents
- Where Intraday History Length Comes From
- How Bar Limits Translate Into Years of History
- What You Get When You Buy Intraday Data
- How Much History Should You Expect by Asset Class
- Clean Minute-Bar Data Built for Backtesting Since 2014
- When More History Helps, and When It Just Adds Noise
- Get Clean, Import-Ready Intraday Data Without the Guesswork
- Sources
- FAQ
Where Intraday History Length Comes From
The source you pick determines the ceiling on your data, and the four main categories behave very differently.
Primary exchange archives sit at the top for depth and authority. NYSE's Daily TAQ records trades and quotes back to 1993, giving researchers over three decades of tick-level equity data, though timestamp precision and field structure changed multiple times over that span as the exchange upgraded its systems. Consolidated feeds built on top of the Securities Information Processor record similar depth for listed markets, but retention and format vary by which vendor packaged the feed.
Commercial data vendors occupy the middle ground, and their marketing tends to run ahead of what any single dataset actually contains. Some vendor pages advertise up to 25 years of intraday history across multiple resolutions, while others describe tick archives spanning three decades or more. Treat these figures as ceilings for the best-covered instruments, not guarantees for every symbol in the catalog. Coverage gaps, delisted tickers, and inconsistent adjustment methodology are common enough that verifying completeness before you buy matters more than the headline number.
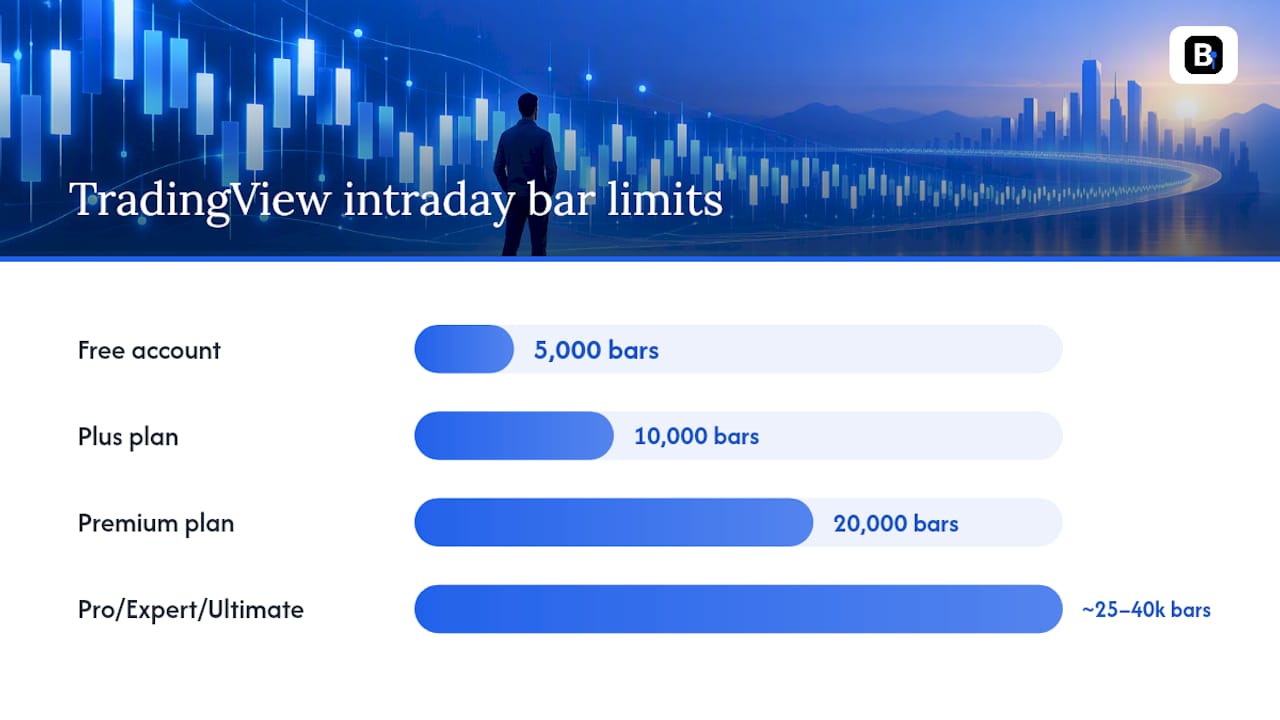
Charting platforms work on a completely different model. TradingView caps intraday history by bar count rather than date range: free accounts get 5,000 bars, Plus plans get 10,000, Premium reaches 20,000, and the higher-tier Professional, Expert, and Ultimate plans push toward 25,000 to 40,000 bars depending on the instrument and interval.
Rolling-window APIs add a fourth wrinkle. FactSet's Intraday Tick History API retains only 12 months of trade and BBO quote data, and just 30 days for options, which means tick-level research beyond that window requires separate licensing or archive access.
A few practical routes worth knowing:
- Exchange archives for regulatory-grade equity history
- Vendor bundles for multi-instrument minute or tick coverage
- Platform exports for quick prototyping within bar limits
- API pulls for recent, rolling-window tick research
- Community-sourced approaches, discussed on quant forums, that combine several of the above
How Bar Limits Translate Into Years of History
A bar limit sounds abstract until you convert it into calendar time, and the math is not flattering for 1-minute data.
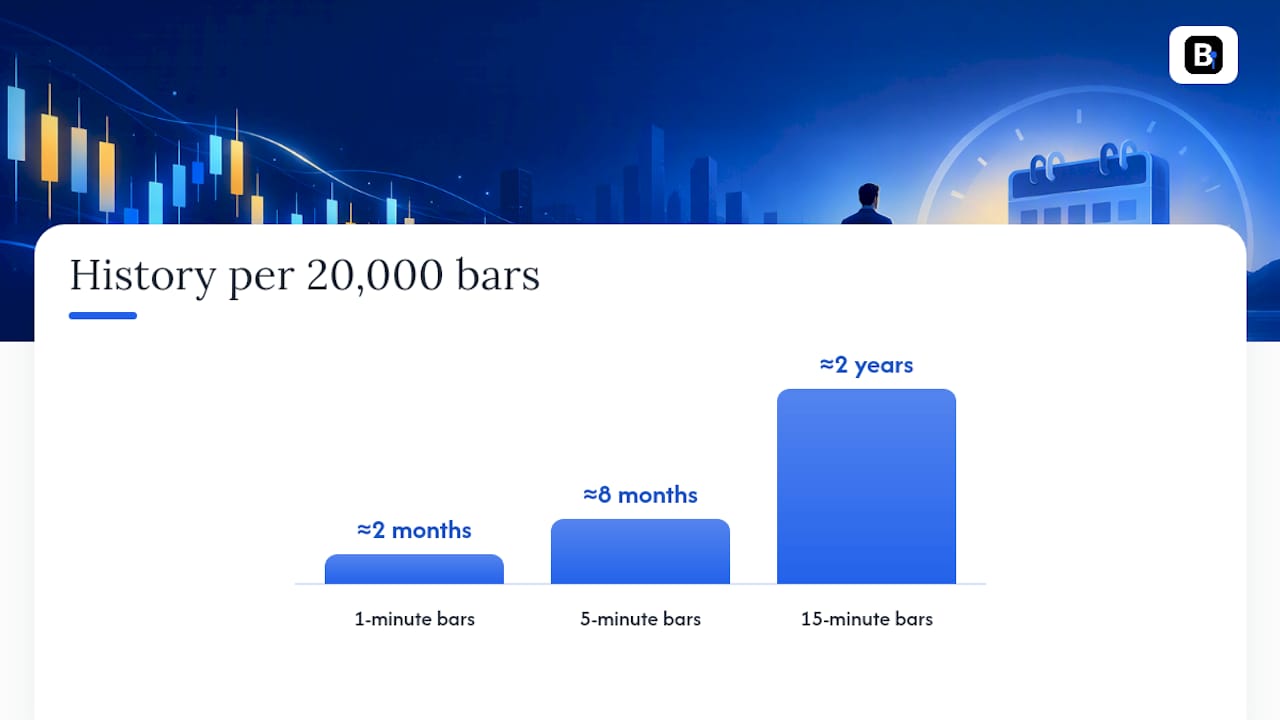
A standard US regular trading hours session runs 6.5 hours, or 390 minutes. That means 390 one-minute bars per trading day, and roughly 252 trading days per year works out to about 98,280 one-minute bars annually. Run that against a 20,000-bar platform limit and you get roughly ten weeks of continuous 1-minute history, not years.
Wider intervals stretch the same bar budget dramatically further:
| Bar limit | 1-minute bars | 5-minute bars | 15-minute bars |
|---|---|---|---|
| 5,000 | ~2 weeks | ~2 months | ~7 months |
| 10,000 | ~1 month | ~4 months | ~1 year |
| 20,000 | ~2 months | ~8 months | ~2 years |
| 40,000 | ~4 months | ~1.5 years | ~5 years |
A 40,000 bar cap on a 15-minute chart buys you multiple years of history, while the same cap on a 1-minute chart covers only a few months. That gap is why serious backtest work on short intervals almost never happens inside a charting platform's native limits. It happens against downloaded datasets.
Tick data compounds the problem further. A liquid futures contract can generate tens of thousands of ticks per session, so even a modest multi-year tick archive runs into terabytes. That storage burden is exactly why rolling-window APIs like FactSet's exist. Vendors trade completeness for practicality, keeping recent tick data fully queryable while pushing older history into bulk archive formats or dropping it entirely. If your strategy genuinely needs multi-year tick resolution, budget for either heavy storage or a vendor relationship built specifically around historical tick licensing. Multi-year minute-bar data, by contrast, is a solved problem for most liquid instruments and fits comfortably on a laptop.
What You Get When You Buy Intraday Data
Downloaded datasets differ from platform charts in format, structure, and the work required before a backtest engine can use them.
Delivery typically comes as CSV or Parquet files, sometimes through a vendor API, formatted for direct import into MT4, MT5, or NinjaTrader. Back-adjusted futures series matter here specifically: a raw, contract-chained futures series shows artificial price jumps at every rollover date, while a back-adjusted series smooths those jumps out so your backtest doesn't mistake a contract switch for a real price move.
Before loading any dataset into a strategy tester, check for a few things:
- Timestamp normalization to a single timezone, with daylight saving time transitions handled consistently
- Clear labeling of regular trading hours versus 24-hour session data
- Documented split and dividend adjustment methodology for equities
- A stated gap-fill policy, since silently interpolated bars can distort volatility calculations
Pro Tip: Always sessionize your data before running a backtest. A dataset that mixes regular and extended hours without a clear flag will quietly inflate your volatility numbers and produce entry signals that never would have triggered in the real session. For a deeper walkthrough on validating minute-bar imports for MT5, see this MT5 backtesting data guide, and if you're working in NinjaTrader, the import process is covered here.
How Much History Should You Expect by Asset Class
History length varies sharply by instrument, and the reasons are structural, not just commercial.
Equities benefit from the deepest archives, since exchange TAQ data goes back to 1993 and vendors build extensively on that foundation. Coverage quality for any single ticker still depends on the vendor's handling of delistings, symbol changes, and corporate actions. The Nasdaq intraday data guide covers the specifics of accessing and validating exchange-level equity feeds.
Futures commonly ship as continuous, back-adjusted series that stitch multiple contract months into one clean price line. Exchange start dates vary widely by contract, so a decades-old index future and a recently listed micro contract will never offer the same history length.
Options trail behind. Rolling windows as short as 30 days are common on API-based tick access, and long-term tick-level options archives are sparse compared to equities or futures.
Foreign exchange data tends to be strong at the minute-bar level, with vendors often supplying several years of continuous history for major pairs. Consolidated tick-level FX history is less standardized since FX trades over the counter rather than through a single exchange.
Crypto pairs can offer long histories for major exchanges, but early years often carry data quality gaps, since exchange APIs and reporting standards were far less mature in crypto's first years than they are now.
Clean Minute-Bar Data Built for Backtesting Since 2014
A vendor has supplied clean, minute-bar intraday datasets across forex, metals, stock indices, bonds, and commodities since 2014, packaged for direct import into MT4 and MT5. Every dataset in the catalog is built around the same idea covered above: raw calendar span means little if the underlying bars have gaps, bad timestamps, or unclear adjustment history.
Two products worth knowing if you trade Asian-session index exposure: Hang Seng Back Adjusted 5m delivers back-adjusted 5-minute bars suited to shorter-horizon systems, while Hang Seng Back Adjusted 15m fits strategies that trade less frequently but still need session-level granularity.
A few things that matter once you're actually running strategies against the data:
- Bar-by-bar verification against source feeds before a dataset ships
- Documented adjustment methodology so back-adjusted futures and index series behave predictably in a backtest engine
- Direct support from the engineers who collect the data, not a generic help desk
Pro Tip: When you request a sample dataset from any vendor, load it into your backtest engine and check the very first and last bar of each trading day. Missing or duplicated open/close bars are the fastest way to spot a sloppy feed before you build a strategy on top of it. For more on what real engineering support should look like when you hit an import issue, see this vendor support breakdown.
When More History Helps, and When It Just Adds Noise
More years of data doesn't automatically make a backtest better. Market structure shifts, venue fragmentation, and changing timestamp resolution mean bars from a decade ago don't always behave like the market you're trading today. Clean, well-documented data over a shorter window often beats a longer series with unclear provenance. Before trusting any backtest, run session parity checks, replay the data deterministically, and hold out a genuine out-of-sample period rather than testing on everything you have. The minute-bar data checklist covers these validation steps in more depth.
— Start
Get Clean, Import-Ready Intraday Data Without the Guesswork
Vendor archives and platform exports both leave gaps: one buries you in raw files that need cleaning, the other caps you at a bar count that barely covers a season of trading. Complete, clean minute-bar datasets are available, already verified and ready to drop into MT4 or MT5, so you can skip the cleanup step entirely.
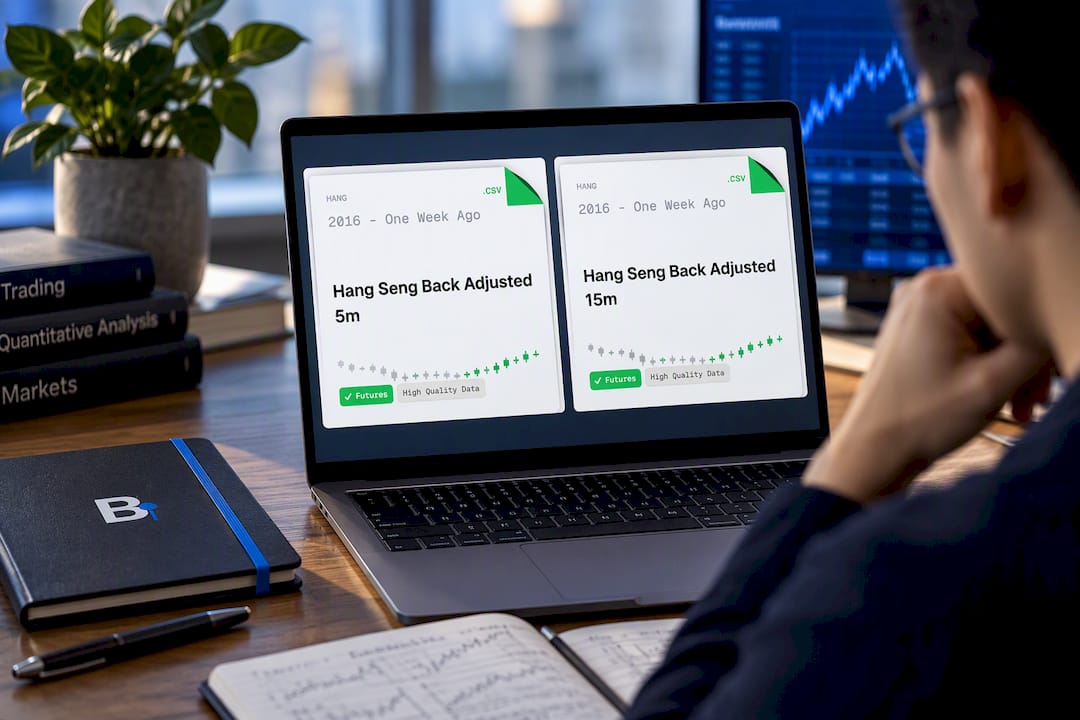
Start with the Hang Seng Back Adjusted 5m dataset if you're building shorter-horizon systems, or the Hang Seng Back Adjusted 15m version for slower strategies. The full catalog covering forex, metals, bonds, and indices lives on the Historical Data page, and traders who want ongoing access across multiple instrument sets can check the Annual Plan at $119 per year. If you're building automated systems rather than manual ones, the Expert Advisors and Indicators library is worth a look too. Reach out to the engineering team directly if you need help verifying a dataset before you buy.
Sources
FAQ
How Far Back Does TradingView Data Go?
TradingView doesn't limit history by date, it limits it by bar count, and that count depends on your plan: 5,000 bars on free accounts up to roughly 40,000 on the highest tiers. On a 1-minute chart that still translates to weeks or months rather than years, which is why longer backtests typically require a downloaded dataset instead.
What Is the 3-5-7 Rule in Day Trading?
The 3-5-7 rule is a risk-management guideline that caps single-trade risk around 3%, total open-position risk around 5%, and overall portfolio risk around 7%. It has nothing to do with data history length directly, but it's a common framework traders apply once they've backtested a strategy against sufficient historical bars to size positions with confidence.
Which Timeframe Is Best for Intraday Trading?
There's no single best interval. It depends on your strategy and how much history you need to validate it. Many traders favor 5-minute bars over 1-minute charts because 1-minute data tends to carry more algorithmic noise, while 5-minute bars still preserve intraday structure with cleaner signals.
How Much Do Traders With $50,000 Accounts Typically Make Per Day?
There's no reliable, universal figure for daily profit on any account size, since outcomes depend heavily on strategy, leverage, risk management, and market conditions. Any specific daily dollar figure you see quoted online should be treated as anecdotal rather than a statistical average.
Does Backtestmarket Offer Multi-Year Minute-Bar Data?
Yes. Backtestmarket has provided clean, back-adjusted minute-bar datasets across forex, metals, indices, bonds, and commodities since 2014, packaged for direct import into MT4 and MT5. Pricing for ongoing access runs through the Annual Plan at $119 per year, with individual datasets like Hang Seng Back Adjusted 5m available on their own product pages.
Recommended
- Minute Bar Data: What Quants Need for Reliable Backtests
- Nasdaq Intraday Data: Access, Specs, and Practical Use
- Holiday Gaps in Market Data: A Quant's Handling Guide
- 5 Audits Quants Must Run on Outlier Handled M1 Data Before MT4/MT5
Related resources
Explore BacktestMarket's historical data packs to put the ideas in this article into practice.