Market Update: Dollar Index and S&P 500 Forecast
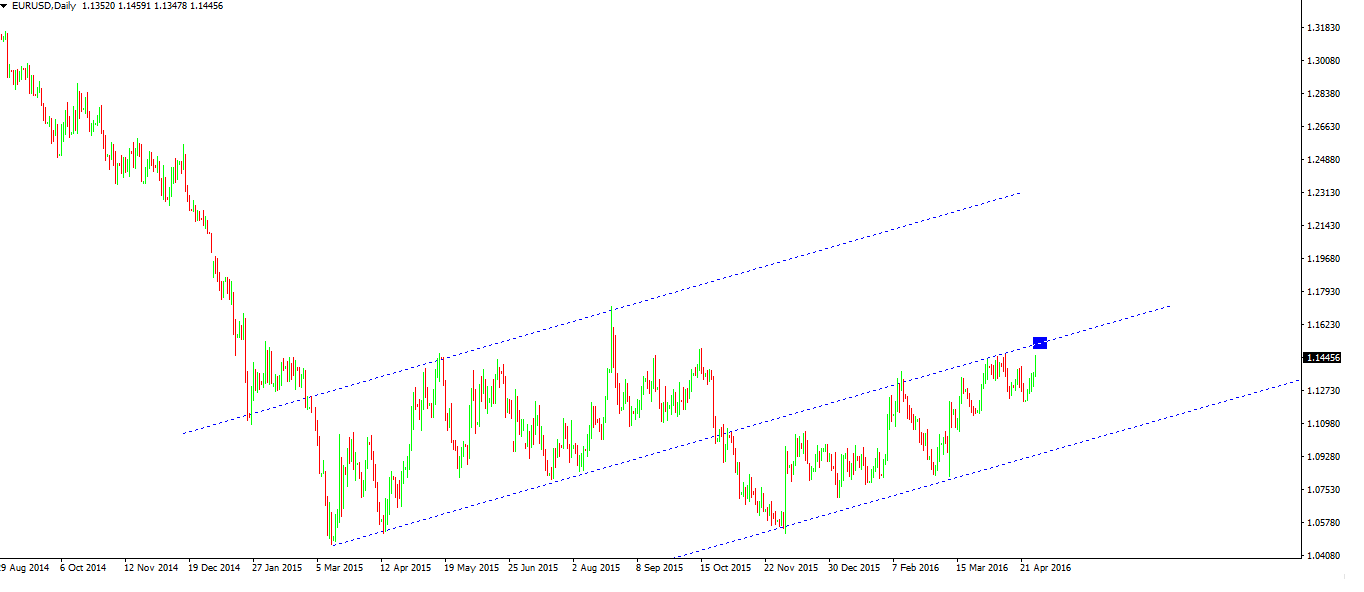
This week I'll show you the S&P forecast and I think here it is a great opportunity for the next weeks to make some money. Last week I pointed out how EurUsd could be ready for a bearish rally but this did not happen mainly because of the weakness of the dollar. Thursday I closed the position with a small loss and I want to recover in the way that I'm about to show you.
Dollar Index
The dollar index (in which the euro has a weight of 57.6%) is located on a very important support level — a yearly support. It lies at a crossroads:
- Bounce at the support
- Break out and accelerate downward
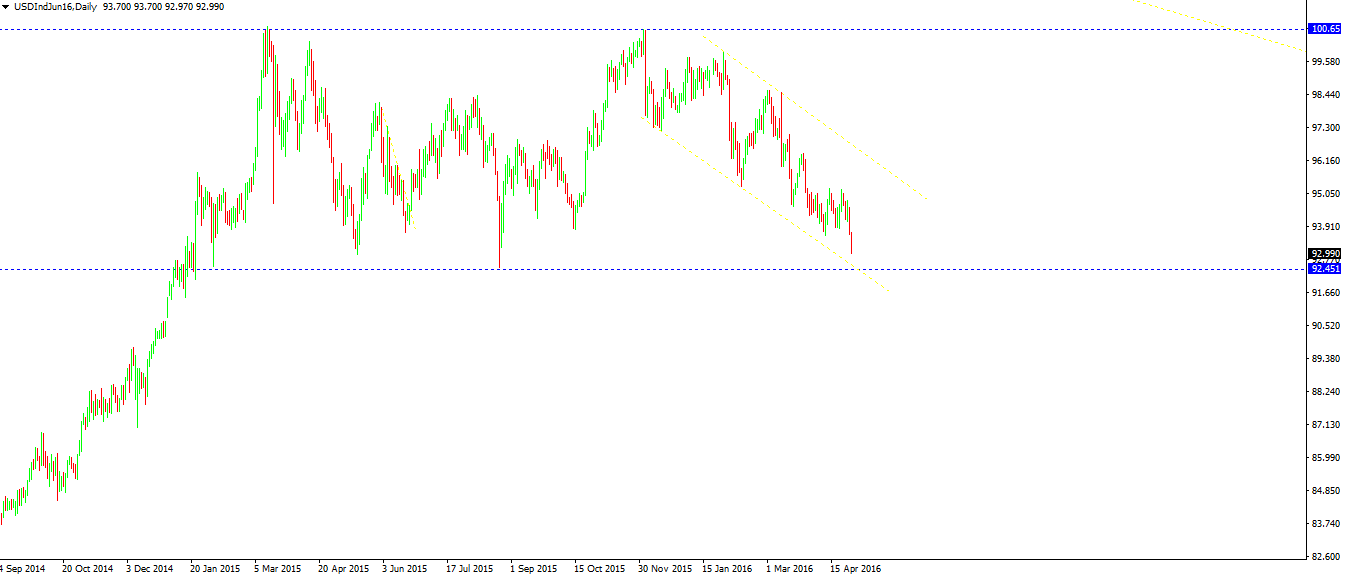
The support of the Dollar Index probably will coincide with the retest of the trendline. If next week the market goes up there I'll sell a small position with a tight stop — so high risk/reward.
Stock Market — S&P 500 Forecast
Where I see more interesting opportunities than in Euro/Dollar is in the stock market. Here is the US S&P 500 index.
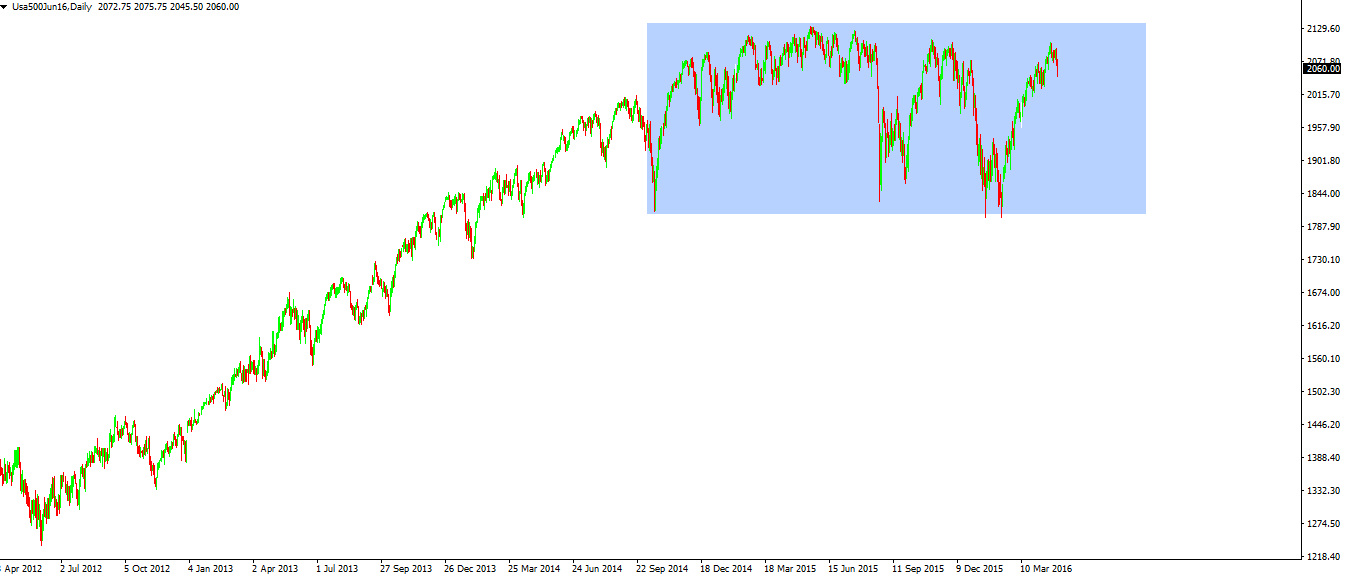
As you can see, from October 2014 — about 1 year and a half — it is swinging between the extremes of this blue horizontal band. As you're about to see, now at 2,060 points, in the HIGH band. A return to the LOW zone at 1,800 points is a -12%. The price on Friday has punctured the 21 exponential average that served as support, and the price closed below. Note what happened after it broke in March.
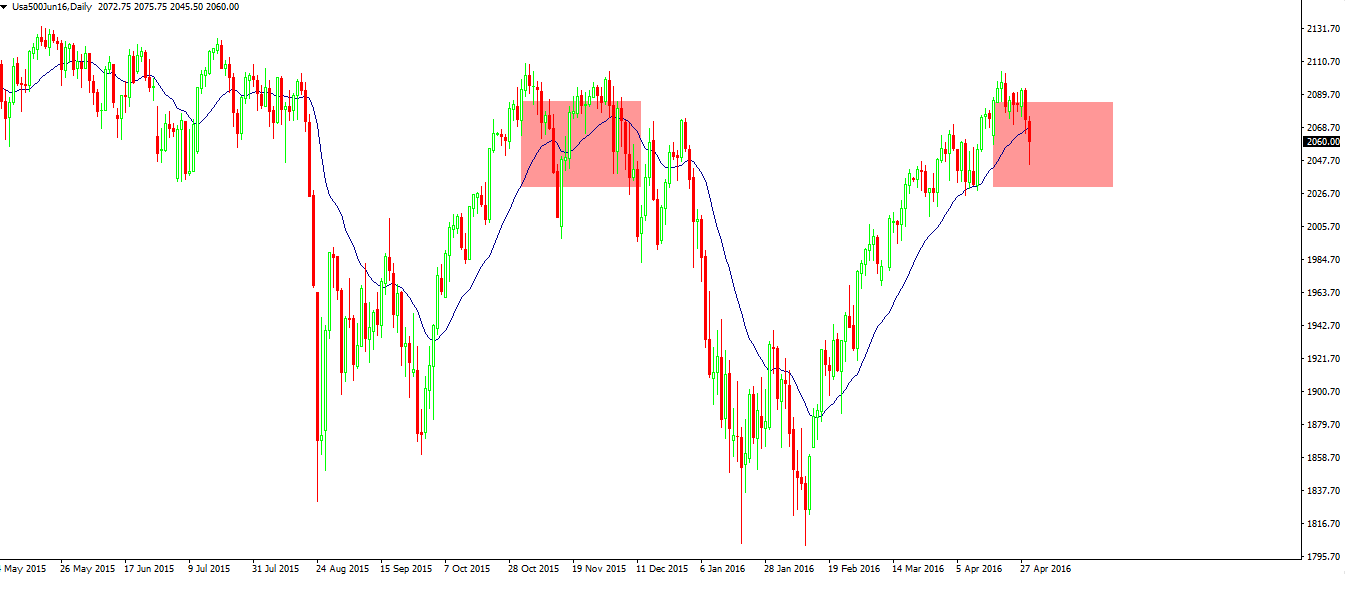
This S&P forecast can be achieved in a week or in two-three weeks if, after a first descent, the S&P will retract to do a double top.
A very nice clue supporting the hypothesis of a decline comes from the distance between the maximums:
- From the maximum of 20 May 2015 to the 03 November 2015 the distance is exactly 120 days
- 03 November 2015 + 120 days = 20 April 2016, the exact day of the recent S&P top
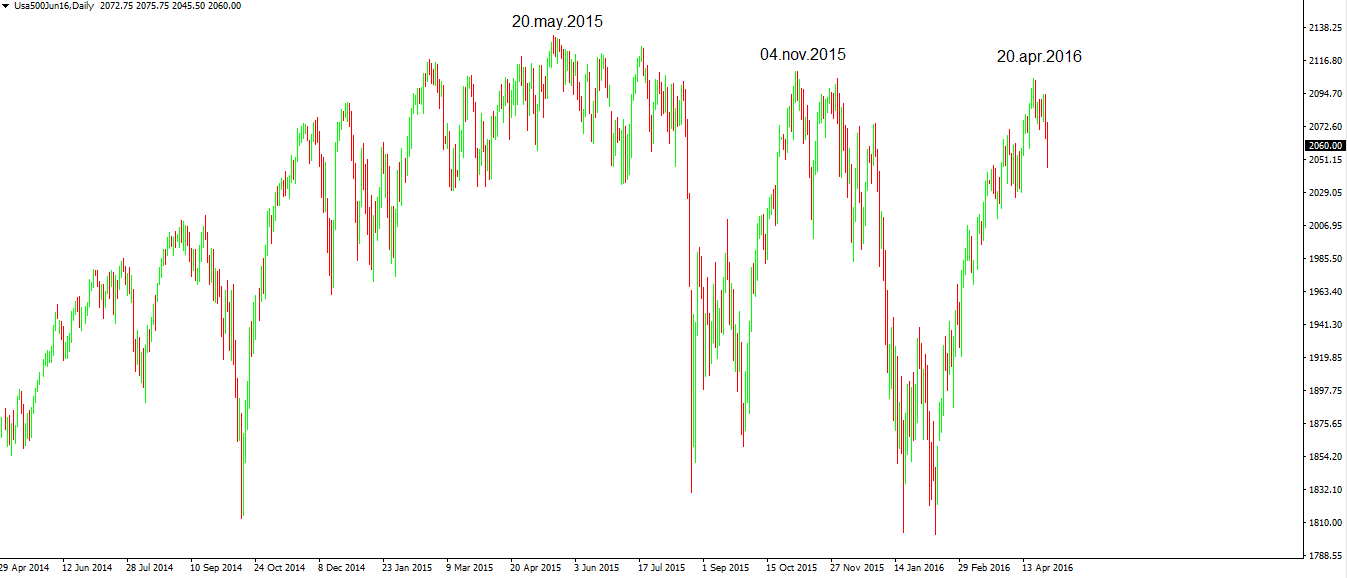
Since Friday we are bearish with stop above the highs and probably we will increase the position next week.
Although the chances are in favor, as every time, this S&P forecast can be contradicted by the market. "The market is always right" — then protect ourselves with the stop loss.
Good trading, Andrea