Minute bar backtesting accuracy is how closely a strategy's simulated results on 1-minute OHLC bars match what the same rules would have earned live. It rests on two things you control: the quality of the bars (no gaps, no phantom prices, correct sessions) and the honesty of your execution assumptions (spread, slippage, fills). No backtest is exact, but a clean dataset and pessimistic cost modeling get you much closer.
TL;DR
- A backtest is an approximation of live execution, never a replica. Spreads, requotes, slippage and delays all separate the two.
- A minute bar stores open, high, low and close, but not the order in which prices were touched. Stops and targets inside one bar are a guess.
- Audit your data before you trust it: missing bars, stale bars, phantom highs and lows, and early-close sessions are the usual culprits.
- Model costs pessimistically, then validate with out-of-sample tests and a small live or paper run.
- Clean, documented data removes one whole class of error, so any remaining gap is about execution, not the file.
Table of Contents
- What "accuracy" means for a minute bar backtest
- Why minute bars hide what happened inside the bar
- Audit your minute data before you trust the result
- Model the costs the bar cannot show
- Validate beyond a single backtest
- Our perspective on minute data quality
- Get clean minute bars ready for MT4 and MT5
- A pre-run checklist
- FAQ
- Sources
What "accuracy" means for a minute bar backtest
The honest definition is modest. One strategy-building vendor's documentation says a backtest cannot be 100% accurate and at best offers a close approximation of real-time execution, because widened spreads, requotes, slippage, time delays, network disconnects and VPS failures all affect live trading.
So the useful question is not "is my backtest right?" but "how large is the gap, and which direction does it lean?" Errors usually come from four places:
- The data: bars that are missing, duplicated, synthetic or mis-timed.
- The bar itself: four numbers standing in for 60 seconds of trading.
- The execution model: fills at a price you could not have received.
- The strategy: parameters fitted so tightly to history that they fail on anything new.
The first is fixed with better data. The other three are fixed with better method. Both are covered below.
Why minute bars hide what happened inside the bar
A 1-minute bar compresses a minute of trading into open, high, low and close. If a bar's high would have hit your take-profit and its low would have hit your stop-loss, the bar cannot say which came first. Your backtest engine must pick an order, and that pick is an assumption, not a fact.
A documented example of how this plays out in practice: one backtesting platform that works on 1-minute OHLC data checks profit and loss at the close of each candle, while live trading checks those conditions continuously. A strategy may have touched its target or stop live, while the candle close showed nothing.
Where the ambiguity bites hardest
- Tight stops and targets. The smaller your stop and target relative to the average 1-minute range, the more often both fall inside one bar.
- Holding periods near one bar. When the trade duration and the data interval line up neatly, precision problems around the entry bar inflate results.
- High-volatility minutes. News and opens produce wide bars, exactly where order of touch matters most.
How to reduce the guesswork
- Adopt a conservative tie-break rule: when both levels are inside one bar, assume the stop was hit first. This biases results down, which is the safer error.
- Run the strategy twice, once assuming stop-first and once target-first. If the two equity curves diverge sharply, your edge depends on a coin flip.
- Widen stops and targets relative to bar range where the strategy logic allows it.
- Check whether finer data is warranted. Our guide to tick versus minute data explains when a strategy's holding period justifies stepping down, and the signature plot approach shows when 1-minute and 5-minute bars tell different stories.
Audit your minute data before you trust the result
Before tuning anything, check the file. Intraday research from Concretum identifies four core problems: early-close leakage, phantom highs and lows, strong stale bars and missing intraday bars.
Missing bars and stale bars
A strong stale bar is a 1-minute bar where open, high, low and close are identical. According to the same research, some providers synthesize these from the prior close while others omit the minute, so the same quiet market shows up either as a flat bar or as a hole in the grid.
This matters because backtests on filled data can generate trades that were impossible live, such as stops executed against volatility that was synthesized. Flag these regions and either exclude them or report results on the clean subset separately.
A practical check in pandas:
- Build the expected minute grid for each session.
- Compare it to your timestamps and count empty positions.
- Count duplicate timestamps and rows where open, high, low and close are all equal.
- Report the share of bars affected by month, not just overall. Problems tend to cluster.
Our walkthrough on resampling minute data in pandas shows how to catch thin buckets before they distort a higher timeframe.
Phantom highs and lows
A single bad print can stretch a bar's high or low and trigger a stop that never could have filled. A simple spike test compares each bar's extreme to its neighbors and to recent volatility. We lay out a three-condition spike test you can run on any minute file.
Sessions and early closes
A missing hour is not automatically corruption. Markets close, holidays exist and scheduled breaks happen, so your checks need context rules rather than a blind grid.
Early closes are a good example for US equities and index products. Concretum notes that a few NYSE sessions close early each year, typically at 13:00 ET (the day after Thanksgiving, Christmas Eve and the session before Independence Day), and that some providers keep reporting bars until the normal 16:00 ET close. Those extra bars are structurally invalid for any strategy that assumes standard session boundaries. Confirm the early-close dates against the exchange calendar for the year you test.
Other market-specific checks before you rely on results:
- Time zone and daylight saving. A one-hour shift moves your session open and any time-of-day filter.
- Futures roll and adjustment. Unadjusted continuous contracts show fake gaps at each roll. Back-adjusted series remove them, and the adjustment method should be documented.
- Instrument conventions. Forex has no central exchange, so bar values depend on the feed. Index and bond data have their own session hours.
Model the costs the bar cannot show
Even perfect bars do not tell you what you would have paid. Three assumptions do most of the damage.
Spread and bid/ask
Filling at the bar close ignores that buys execute at the ask and sells at the bid. In MT5, the 1-minute OHLC model also does not reproduce the sudden spread widening around major news releases, so fixed-spread backtests on scalping strategies come out too optimistic. The more a strategy trades, the more spread matters.
Commission and slippage defaults
Defaults flatter results. TradingView strategies, for example, assume zero commission and zero slippage unless you change them, which treats every entry and exit as if it occurred at the exact modeled price. Always set both explicitly.
A backtest fee model should also match the account you will actually trade, including per-contract fees, borrow costs for shorts and financing for margin. If you are choosing an account, matching fees to your account is part of getting the test right before you size anything.
Fill assumptions and liquidity
A backtest fills at a price taken from historical bars, while live you get what the order book offers at the instant your order arrives. On a liquid instrument the two may be close, while on a thin one they may not be. Limit orders deserve extra suspicion: a bar touching your price does not mean you were first in the queue.
A simple, repeatable approach is to stress the model:
| Test | What to change | What it tells you |
|---|---|---|
| Spread stress | Double the average spread | Whether the edge survives wider costs |
| Slippage ladder | Add 0, 1, 2, 3 ticks per side | Where profit turns to loss |
| Intrabar tie-break | Stop-first vs target-first | How much the result depends on bar order |
| Skipped trades | Randomly drop 5 to 10% of entries | Sensitivity to missed fills |
For a tick-level fill formula you can adapt, see our one-line fill formula for minute bar slippage.
Validate beyond a single backtest
A strategy that looks excellent on one pass over history may simply be fitted to it. Robustness is the property to chase: the strategy should stay profitable when data, parameters or a few trades change, rather than working only on the sample it was built on.
A workable validation sequence:
- Hold out data. Build on one period and test untouched on another. Our guide to out-of-sample testing covers the splits.
- Perturb parameters. Nudge each input by 10 to 20%. A cliff in performance means a fragile fit.
- Change the data. Run the same rules on a different instrument or a second clean source. Differences point to feed-specific artifacts.
- Step down in resolution. Re-run the trades that had both stop and target in one bar on finer data to see what actually came first.
- Paper trade, then trade small. Compare live fills against the backtest's assumed fills trade by trade and adjust your cost model to the gap.
Our perspective on minute data quality
We collect and maintain our minute-bar datasets ourselves, and our view is simple: if you cannot trust the bars, you cannot interpret anything built on top of them.
Most debates about why a backtest missed live results jump straight to slippage and psychology. Those matter. But a gap, a duplicated minute or a phantom spike changes your trades before any execution model is applied, and you cannot separate the two causes if the data is unclean. That is why we verify our data bar by bar, document adjustments, and hold to a strict quality standard that applies equally to human and AI-driven backtesting.
Clean data does not make a backtest perfect. It makes it diagnosable. When the data is known-good, the remaining difference between test and live is about execution, which you can measure and model. Our engineers answer support questions directly, because the people who collect the data are the ones who know how it was built.
Start
Get clean minute bars ready for MT4 and MT5
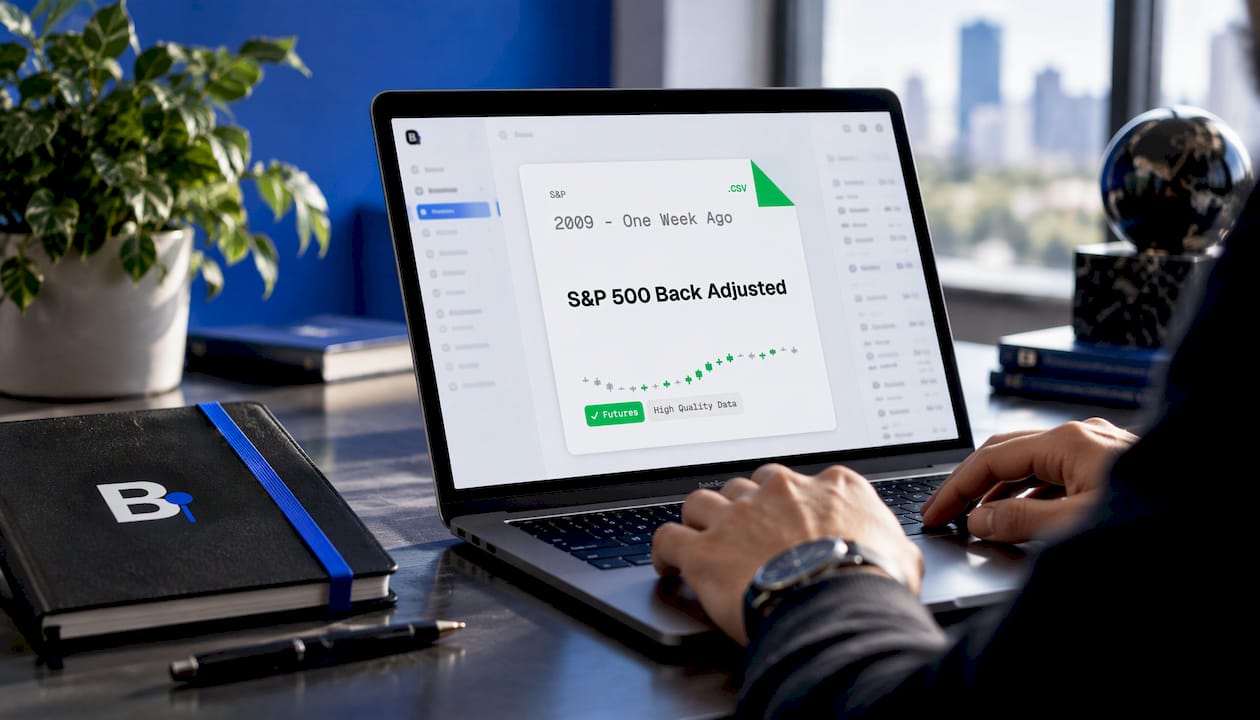
If you would rather spend your time on strategy logic than on auditing files, our Historical Data page lists complete minute-bar datasets since 2014 across forex, metals, stock indices, bonds and commodities, built for direct import into MT4 and MT5. Datasets are a one-time download, and back-adjusted futures data is available, such as the S&P 500 back-adjusted series.
The Annual Plan is €119 per year. If you are comparing sources first, our guides to verified OHLCV minute data and forex minute data sources explain what to look for.
A pre-run checklist
Before you trust any minute-bar result, confirm:
- No unexplained gaps, duplicate timestamps or runs of flat bars in the test period.
- Session times and early closes match the exchange calendar and your time zone.
- Futures are back-adjusted, with the method documented.
- Spread, commission and slippage are set explicitly and match your real account.
- Stop and target ties inside one bar are resolved conservatively.
- The result survives out-of-sample data and small parameter changes.
For more on how timeframe choice affects results, read why minute charts need cleaner data.
FAQ
How accurate can a minute bar backtest be?
It can be a close approximation but never exact. Minute bars omit the order of price moves inside the bar, and live trading adds spreads, slippage and delays. Clean data and pessimistic cost assumptions narrow the gap.
Is tick data always more accurate than minute data?
Not always. Tick data shows intrabar order, which helps strategies with tight stops or very short holding periods. For strategies that hold for many minutes or hours, clean minute bars are often enough and far lighter to work with.
How do I find missing minute bars?
Build the expected minute grid for each session and compare it to your timestamps. Count empty slots, duplicates and bars where open, high, low and close are equal. Then apply session rules so holidays and early closes are not flagged as errors.
Why does my backtest beat live trading?
The usual causes are zero or understated costs, fills at prices the market did not offer, intrabar order assumptions and parameters fitted to history. Stress test spread and slippage, then compare live fills to modeled fills.
Sources
- Reliable backtesting in TradeStation and MultiCharts (StrategyQuant documentation)
- Difference between backtest, forward test and live trading (AlgoTest docs)
- How to Detect and Fix Problems in Intraday Market Data (Concretum Research, Substack)
- How to Detect and Fix Problems in Intraday Market Data (Concretum Group)
- MT5 Backtest Models: Every Tick vs Real Ticks vs 1 Minute OHLC (FXEA365)
- Why Automated Trading Strategies Fail (TradersPost)
- 9 Reasons Your Backtest Doesn't Match Live Trading (Tradetron)
Recommended
- Six Bar Aggregation Methods Quants Can Calibrate for ML Backtests
- Quant Traders: One Line Fill Formula to Simulate Minute Bar Slippage
- Protect Your Backtest: 5-Step Audit for Handling Missing Bars
- Three Ways to Run an MT5 Portfolio Backtest With Clean Minute Bars
Related resources
Explore BacktestMarket's Expert Advisor robots to put the ideas in this article into practice.