

MetaTrader 5's Strategy Tester runs one Expert Advisor at a time, so it cannot natively simulate a shared account balance across multiple strategies. Getting a true MT5 portfolio backtest means either using a dedicated portfolio backtester, aggregating normalized MT5 exports in a Python research engine, or rebuilding your strategies inside a portfolio-capable engine. Whichever route you pick, clean minute-bar data is what actually decides whether the result means anything.
TL;DR:
- Accurate portfolio backtests require aggregating individual strategy results into one account view, which MT5's native tester cannot do alone.
- The best approaches involve dedicated portfolio backtesting tools, local Python aggregation, or reimplementing strategies in a portfolio-capable engine.
- Trusted results depend heavily on clean, gap-free minute or tick data, with pre-aggregation audits essential to avoid silent errors.
- Normalizing data through consistent timestamps, position sizing, and assumptions prevents misleading metrics like Sharpe ratios or drawdowns.
- Analyzing portfolio risk involves monitoring maximum daily drawdowns, strategy correlations, and parameter stability over multiple testing windows.
Table of Contents
- What Is an MT5 Portfolio Backtest and Why Can't MT5 Do It Alone?
- Three Practical Approaches to Run a Portfolio Backtest From MT5 Exports
- Prepare Your MT5 Data: What to Export and How to Check Modeling Quality
- Normalizing Strategy Results Before Aggregation
- Weight-Mode vs Order-Mode: Two Ways to Simulate a Portfolio
- Interpreting Portfolio-Level Metrics and Red Flags to Watch
- A Reproducible Checklist for a Reliable MT5 Portfolio Backtest
- Why Clean Minute-Bar Data Is the Real Bottleneck
- The Data Problem Nobody Talks About Enough
- Sources
What Is an MT5 Portfolio Backtest and Why Can't MT5 Do It Alone?
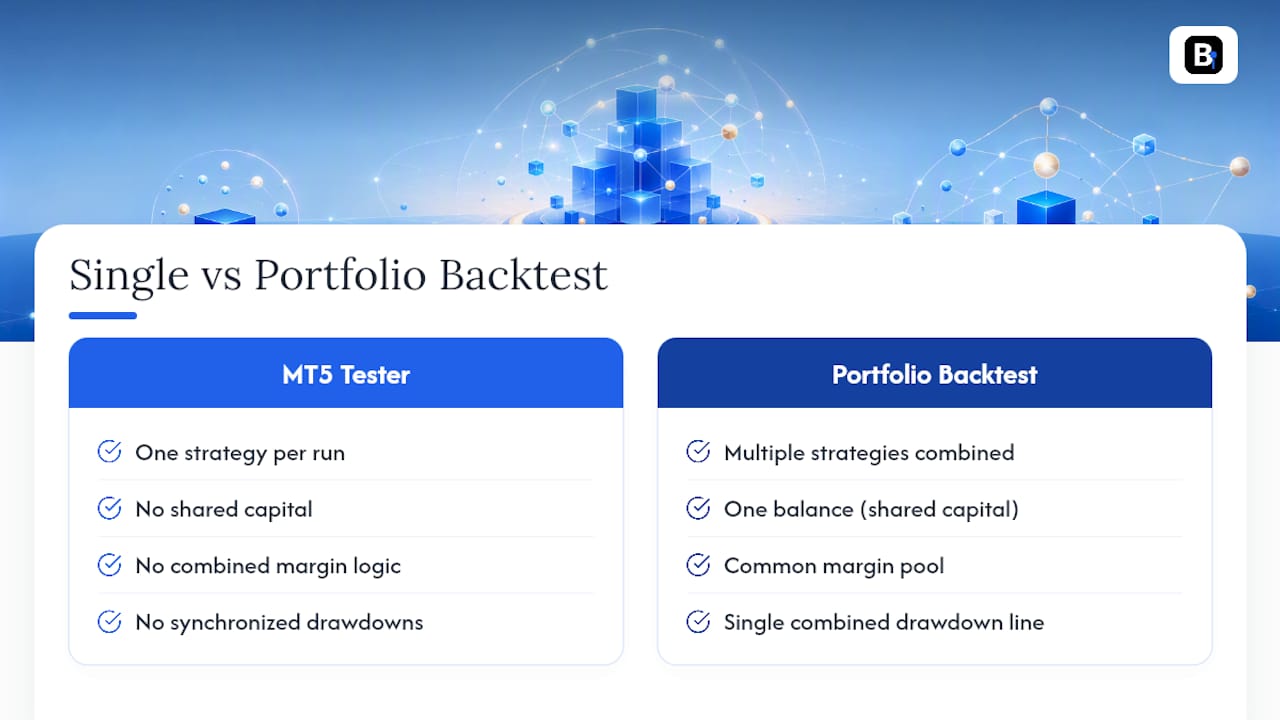
MT5's tester was built for one strategy on one symbol at a time. It has no concept of shared capital, no combined margin logic, and no way to see that Strategy A's drawdown is happening at the exact same minute as Strategy B's. That is not how real trading works, and it is why so many traders discover their "great portfolio" falls apart the moment they trade it live with actual shared risk.
A genuine MT5 portfolio backtest requires pulling those separate results together into one account view, with one balance, one margin pool, and one combined drawdown line. That's a different problem than single-strategy testing, and it needs different tools.
Three Practical Approaches to Run a Portfolio Backtest From MT5 Exports
You have three realistic paths, and they trade off speed against control.
- Dedicated portfolio backtesters. Upload your MT5 backtest reports or trade logs directly, and a tool like Portfolio Backtester combines them with 1-minute price data to compute combined equity, correlation, and prop-firm-style daily drawdown checks. Browser-based analyzers such as StrategyLens work similarly, letting you group backtests into a portfolio without writing code. This is the fastest route if you want answers today, not next week.
- Local aggregation with Python. Import your trade lists and minute OHLC data, normalize position sizing and timestamps yourself, then simulate shared capital and margin usage in a framework you control. Lightweight engines like QBT-Lite handle multi-asset, event-driven intraday simulation with a dashboard for reviewing results. This path takes longer to set up but gives you a fully reproducible, auditable pipeline.
- Reimplement strategies in a portfolio-capable engine. When execution detail actually changes your conclusions, tools like the QuantJourney Backtester support both allocation-style and execution-aware simulation, including slippage and partial fills.
Prepare Your MT5 Data: What to Export and How to Check Modeling Quality
Bad inputs sink a portfolio backtest before you even get to the math. Before combining anything, work through this:
- Export detailed trade lists for each strategy from the Strategy Tester, saving both the
.csvand.htmreports along with the settings you tested under (leverage, spread model, modeling quality). - Get 1-minute or tick data for every instrument involved, then check it for gaps, incorrect GMT offsets, and duplicated or outlier bars before you trust a single number that comes out of it.
- Run basic audits: count missing bars per session, confirm timestamp alignment across instruments, and spot-check whether your tester actually hit 99% modeling quality or silently fell back to a lower tier.
The modeling quality setting in MT4 and MT5 determines how granular your tick simulation is, and a backtest built on 25% quality data is functionally a guess. Pairing that with outlier-handled minute data catches most of the silent errors before they ever touch your portfolio math.
Pro Tip: Before you aggregate anything, open each instrument's minute file and plot a simple bar-count-per-day chart. A visible dip on a normal trading day almost always means missing bars, and it's far easier to catch there than after it's baked into a combined drawdown number.
Normalizing Strategy Results Before Aggregation
Combining raw MT5 outputs without normalizing them first produces numbers that look precise and mean nothing. Four adjustments matter most:
- Align timestamps and bar anchors. Decide up front whether your signals fire on close-to-close prices, open of the next bar, or some event-shifted convention, and apply it consistently across every strategy.
- Convert lot sizes into a common unit. Percent-of-equity or a fixed risk-per-trade convention lets you compare a 0.1-lot forex trade against a 2-contract index trade on equal footing.
- Standardize commission, slippage, and multiplier assumptions. Each instrument carries its own contract specifications, and mismatched assumptions distort combined returns more than most traders expect.
- Aggregate by minute time slice, not by trade close, so the portfolio NAV correctly reflects positions that are open simultaneously and the margin they consume together.
Skipping this step is one of the most common reasons a combined backtest produces an invalid Sharpe ratio or drawdown figure: the underlying data was never on comparable footing to begin with.
Weight-Mode vs Order-Mode: Two Ways to Simulate a Portfolio
Portfolio engines generally fall into one of two paradigms, and picking the wrong one for your question wastes time.
- Weight-mode treats each strategy's output as a target exposure. It handles rebalancing, turnover cost, and cash allocation, and it's the right choice for allocation research where you're asking "how should capital be split," not "what happens tick by tick."
- Order-mode simulates actual order submission: fills, partial fills, time-in-force, and slippage. You need this when intraday execution mechanics genuinely change your results, which is common for high-frequency or tight-stop strategies.
- If you only have MT5 trade logs, you can approximate order-mode behavior by reconstructing fills at minute resolution, applying a conservative slippage model, and running that through a margin engine that accounts for simultaneous positions across instruments.
The QuantJourney Backtester documents both modes explicitly, and the distinction between "weights" and "orders" shapes how NAV gets built either way, which matters more than most traders realize until their live results diverge from the backtest.
Interpreting Portfolio-Level Metrics and Red Flags to Watch
Once the simulation runs, the equity curve alone tells you almost nothing. Watch these instead:
- Max daily drawdown, computed prop-firm style, alongside rolling Sharpe and Sortino ratios over multiple windows, not just one static number for the full period.
- The correlation matrix across strategies. Two strategies that look uncorrelated individually can still lose money on the same afternoon, and pooled drawdown often exceeds any single strategy's worst day because of that overlap.
- Parameter instability across folds and Sharpe decay in walk-forward tests, both classic signs that a strategy was fit to noise rather than a real edge.
Pro Tip: Run the same portfolio through a Monte Carlo resample of trade order. If your Sharpe ratio swings wildly depending on the sequence trades happened in, that's a fragile edge, not a real one. Walk-forward and Monte Carlo stress tests exist specifically to separate the two.
A Reproducible Checklist for a Reliable MT5 Portfolio Backtest
Work through these five steps in order, every time:
- Export MT5 reports and save the exact Strategy Tester settings used for each run.
- Confirm minute-bar data coverage for every instrument and run your gap and timestamp audits.
- Normalize position sizing, timestamps, and commission assumptions, then choose weight-mode or order-mode.
- Run the combined simulation and compute institutional metrics alongside Monte Carlo or walk-forward sensitivity tests.
- Archive the raw inputs and every generated artifact, CSV, JSON, and chart, so the result can be checked again later.
That last step matters more than it sounds. A portfolio backtest nobody can reproduce six months later isn't evidence of anything.
Why Clean Minute-Bar Data Is the Real Bottleneck
Every step above assumes the underlying price data is trustworthy, and that assumption fails more often than traders admit. Naive MT5 exports frequently carry gaps, misaligned timestamps, and duplicated bars that distort intraday fill simulation and throw off daily drawdown checks, which is exactly the metric prop-firm style rules hinge on.
One provider builds its datasets around that specific failure point, offering one-time downloads of audited, minute-bar historical data ready to import directly into MT5, along with published audit notes and support when a gap or offset needs diagnosing. For a portfolio backtest spanning several instruments, that audit step at the start saves far more time than it costs.
The Data Problem Nobody Talks About Enough
Most guides on portfolio backtesting spend their time on the math: correlation matrices, Sharpe decay, walk-forward folds. That math is necessary, but it's not where most portfolio backtests actually fail. They fail earlier, in the data.
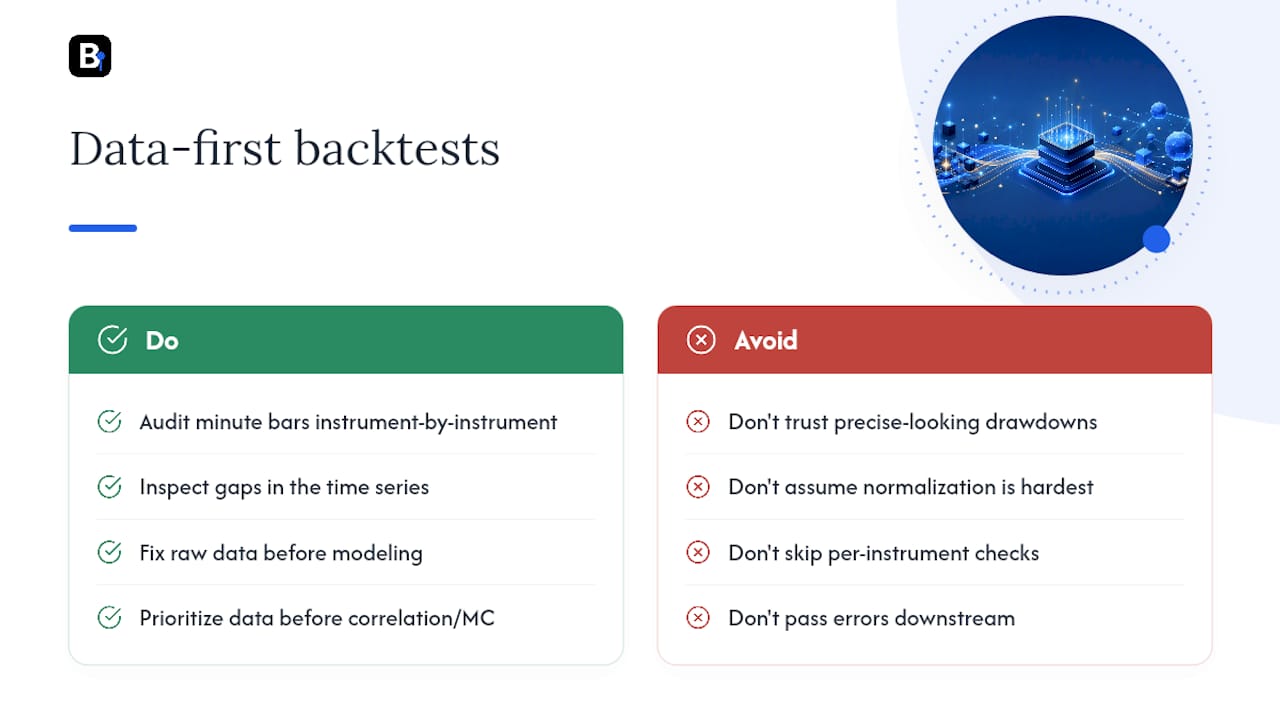
Any one of those, multiplied across five or six strategies sharing a combined account, produces a drawdown number that looks precise and is quietly wrong. The conventional advice treats normalization as the hard part. It's really the second hardest part.
If there's one thing worth prioritizing before touching a correlation matrix or a Monte Carlo run, it's auditing your minute data first, instrument by instrument, gap by gap. Everything downstream, weight-mode or order-mode, Python or a dedicated tool, inherits whatever errors are sitting in that raw data. Fix the foundation, and the rest of the workflow gets a lot more trustworthy.
— Start
Sources
- Portfolio Backtester
- StrategyLens — MT5 Backtest Analyzer
- QuantJourney Backtester Overview - QuantJourney Backtester
Recommended
- Minute Bar Data: What Quants Need for Reliable Backtests
- 5 Audits Quants Must Run on Outlier Handled M1 Data Before MT4/MT5
- How to Achieve 99% Modeling Quality in MT4 for Backtests
Related resources
Explore BacktestMarket's Expert Advisor robots to put the ideas in this article into practice.