

Outlier-handled minute-bar data is M1 price history where bad ticks, spikes, and timestamp defects have been detected and corrected, delivered with a per-year gap audit and an immutable dataset hash. Scalpers, grid systems, and any short-term M1 or H1 strategy need this before trusting a backtest. Longer-swing systems can tolerate looser cleaning, but reproducibility still demands it. Vendor-audited datasets, like the ones Backtestmarket has produced since 2014, remove the guesswork.
TL;DR:
- A high-quality outlier-handled minute data set must include detailed documentation of removal and correction processes, along with comprehensive metadata like timezones and file hashes.
- Auditing data integrity involves five key steps: timestamp-spacing checks, spike detection, stale bar runs, gap classification, and immutability verification through hashing.
- For accurate backtesting in MT4 and MT5, import real tick data with variable spreads, ensure correct platform settings, and verify tick provenance to avoid silent data distortions.
- Dirty data can significantly skew backtest results, especially for scalping or short-term strategies, and different providers can produce materially different minute bars from the same market, affecting strategy evaluation.
- Automated data cleaning pipelines with version control and dataset hashing are essential for maintaining consistency across large sets of instruments and avoiding silent revisions that undermine reproducibility.
Table of Contents
- What a Ready-to-Use Outlier-Handled M1 Dataset Must Contain
- How Do You Audit a Minute-Bar Dataset for Hidden Defects?
- How Do You Import Clean M1 Data Into MT4 and MT5 for Realistic Backtests?
- Practical Examples: How Bad Data Changes Your Backtest Conclusions
- Common Statistical Methods for Detecting Outliers in Price Data
- How Outlier Handling Changes Backtest Performance
- Removal vs. Adjustment vs. Winsorization: Which Technique Fits Minute-Bar Data?
- Setting Thresholds for Outlier Detection Without Losing Real Volatility
- Outlier Handling Across Asset Classes: Forex, Indices, and Bonds
- Automating Outlier Detection in a Data Pipeline
- Why Backtestmarket Builds Outlier-Handled Datasets This Way
- Get Audited M1 Datasets Ready for MT4 and MT5
- Sources
What a Ready-to-Use Outlier-Handled M1 Dataset Must Contain
A dataset earns the label "clean" only if it documents what was removed and why. Before you buy or import anything, check the file structure and the provenance notes that come with it.
At minimum, a usable M1 file needs these fields: timestamp, bid, ask, tick_volume, and spread. Tick-level archives should carry the same fields at tick resolution, since MT4 and MT5 both convert ticks into synthetic M1 bars during import, and the fidelity of that conversion depends entirely on tick completeness. A provider offering only OHLC with no bid/ask spread column cannot support realistic cost modeling, no matter how many years it spans.
Archive depth matters more than most traders assume. Two to five years covers a single volatility regime, but five or more years lets you test through rate hikes, flash crashes, and quiet ranges in the same run. A dataset that only spans 2023 to 2025, for instance, will never show your strategy how it behaves in a 2015-style franc shock.
The cleaning steps themselves should be spelled out, not implied:
- Bad-tick and spike removal, including single-tick prints that spike far outside the surrounding range
- Singleton-spike rules that flag and correct one-off outliers without deleting legitimate volatility
- Stale-bar correction for sequences where a feed simply repeated the last known price
- Early-close handling around holidays so a half-day session doesn't read as a data gap
Statistic to watch: importing real tick archives and running "Every tick" modeling can push modeling quality in MT4 to roughly 99%, a benchmark worth holding any dataset against before you trust its results.
Provenance metadata rounds it out: timezone declared explicitly, a version hash for the exact file you downloaded, a per-day gap report, and a written guarantee that the file won't be silently revised later. Backtestmarket packages this as all-in-one bundles built for direct MT4 and MT5 import, so the minute-bar data you load matches what shipped, not a quietly patched version six months later.
How Do You Audit a Minute-Bar Dataset for Hidden Defects?
You don't need a data science degree to catch the defects that wreck a backtest. You need five checks, run in order, before you ever touch the Strategy Tester.
- Timestamp-spacing audit. Build the expected time grid for the instrument's trading hours and flag any bar that doesn't land where it should. Daily-spaced or evenly repeated timestamps are the clearest sign of synthetic fill bars standing in for real market data.
- Spike and bad-tick detection. Flag any single bar whose high or low deviates sharply from its neighbors with no follow-through on the next bar. Cross-check against a second feed when you have one; a spike that shows up on only one provider is almost always a printing error.
- Stale-bar run detection. Count consecutive bars where open, high, low, and close are identical. A handful during illiquid Asian-session hours is normal; runs of ten or more during London or New York hours point to a feed outage disguised as flat price action.
- Gap classification. Separate benign gaps (weekends, national holidays, early closes) from unexplained ones. An unclassified gap in the middle of a Tuesday session is a red flag, not a rounding error.
- Immutability check. Hash every file you actually load into your backtest engine and store that hash alongside your results. If a vendor revises history later, your hash proves which version produced which numbers.
Pro Tip: Run the timestamp-spacing audit first, before anything else. It takes seconds to script, and it catches the single most common defect, synthetic fill bars, before you waste time on spike hunting inside data that was never real to begin with.
Backtestmarket's data integrity checks walk through this exact sequence with sample scripts, and the holiday gap guide covers step four in more depth for anyone testing across multiple markets with different holiday calendars.
How Do You Import Clean M1 Data Into MT4 and MT5 for Realistic Backtests?
The dataset only matters if your platform actually uses it correctly. MT4 and MT5 handle history very differently, and getting the settings wrong throws away everything you just audited.
In MT4, import your converted tick archive through the History Center, then build a custom symbol so the platform doesn't overwrite your clean data with its own default feed. Run the Strategy Tester on "Every tick" mode, never "Open prices only" or "Control points." MT4 defaults to minute-bar history with synthetic interpolation between bars unless you explicitly import tick data, which is exactly the artifact a clean dataset is supposed to eliminate.
In MT5, import either M1 or full tick data, then select "Every tick based on real ticks" rather than the standard "Every tick" mode. That setting only helps if your broker or data provider actually supplied real tick history. Verify tick provenance before you trust the tester's output, since some brokers still fall back to generated ticks even under this setting.
Spread simulation is where most backtests quietly fail. Either supply a variable historic spread series or confirm your imported ticks carry both bid and ask columns, not a single mid-price. A static spread flatters scalping systems and hides real cost.
Check the Strategy Tester journal after every run for interpolation warnings, and inspect per-day real-tick coverage rather than trusting a single blended modeling-quality percentage. Follow up with a forward-test cross-check against fresh out-of-sample data before you commit capital. Full tick data is mandatory for scalping and grid systems; clean M1 is often sufficient for H1-and-above trend systems where fills matter less than direction. Full walkthroughs for both platforms live in Backtestmarket's MetaTrader import guide.
Practical Examples: How Bad Data Changes Your Backtest Conclusions
The effect of dirty data scales with how tight your strategy's tolerances are. A system with a 200-pip target barely notices a phantom spike. A scalper with a 5-pip target can get flipped from profitable to worthless by the same spike.
- Scalpers and grid systems live or die on the spread and the exact tick sequence. Real ticks and variable historic spreads are close to mandatory here; a single-tick spike can trigger a stop that never should have fired, or skip one that should have.
- Short-term M1 or H1 systems are vulnerable to phantom highs and stale bars flipping entry logic. A breakout system reading a fabricated high as a real touch will enter trades that never happened in the live market.
- Longer-term systems with targets above roughly 50 pips are far less sensitive to individual bad ticks, but clean M1 still matters for walk-forward validation, since a single bad year in the archive can distort an otherwise sound regime test.
- Cross-provider divergence is real and underappreciated: different vendors can produce materially different minute bars from the same underlying market, with phantom highs and stale-bar handling that shift trade counts and win rates between two "identical" backtests.
- Reproducibility depends on freezing the exact file. Vendors revise history over time, so a strategy that tested well in March can test differently in September on the same date range if the underlying file changed underneath you. Hash it, and keep the hash with your results.
Common Statistical Methods for Detecting Outliers in Price Data
Most outlier detection in minute-bar cleaning comes down to a handful of statistical rules, applied bar by bar rather than across a static distribution. A Z-score approach flags any tick whose price deviates by an unusual number of standard deviations from a rolling local mean, useful for catching one-off spike prints in an otherwise stable range.
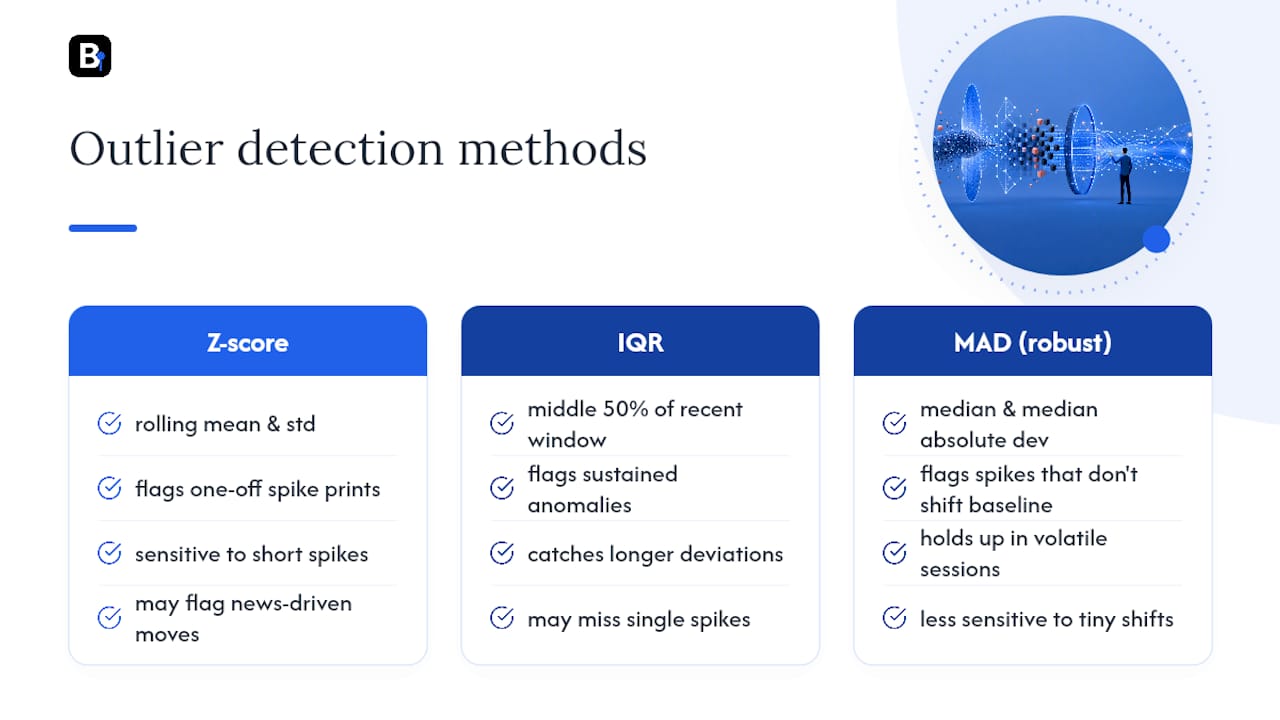
Interquartile range (IQR) methods work differently: they flag values falling far outside the middle 50% of a recent price window, which tends to catch sustained anomalies that a Z-score, sensitive to short-term volatility, might miss. Robust statistics, meaning methods built on the median and median absolute deviation rather than the mean and standard deviation, hold up better during genuinely volatile sessions, since a single huge spike doesn't drag the whole baseline with it the way a mean-based calculation would.
None of these methods work well in isolation on tick data. A rolling Z-score with a fixed threshold flags legitimate news-driven volatility as often as it flags real errors, which is why serious cleaning pipelines combine a statistical trigger with a rule check, like confirming the spike against a second data feed or checking whether the next bar shows any follow-through. A price move that reverts within one bar and never appears on a parallel feed is very likely a bad print. One that persists and shows up elsewhere is a real market event, and treating it as an outlier would erase legitimate price action your strategy needs to see.
How Outlier Handling Changes Backtest Performance
Cleaning your data doesn't just make it look tidier. It directly changes the trade count, win rate, and drawdown your backtest reports, sometimes dramatically.
A single phantom high sitting above your take-profit level will report a winning trade that never actually happened in the live market. Run that error across a year of minute bars and a mediocre strategy can look excellent purely on the strength of fabricated fills. The reverse happens too: a stale bar sequence that flattens price action right where your entry logic expects a breakout can suppress trades that should have triggered, understating a strategy's real activity.
The divergence between data providers on ostensibly identical instruments is large enough that two quants backtesting the same EA on the same date range, sourced from different vendors, can walk away with opposite conclusions about whether the strategy is viable. That's not a rounding difference. That's the entire basis for a go/no-go capital allocation decision resting on which data file happened to load.
The practical takeaway: never trust a single clean backtest run as proof of edge. Run the same strategy against a cleaned dataset and, where possible, a second independent source. If the performance profile survives that cross-check, you're looking at something closer to a real edge rather than an artifact of one provider's tick assignment quirks.
Removal vs. Adjustment vs. Winsorization: Which Technique Fits Minute-Bar Data?
Three broad techniques handle outliers once you've found them, and picking the wrong one for market data can be worse than doing nothing.
Removal deletes the offending bar or tick entirely. This works cleanly for a bad print, a single tick with no market basis, since the bar shouldn't exist in the first place. It's the wrong tool for a real but extreme price move; deleting a genuine flash-crash bar erases information your strategy needs to have been tested against.
Adjustment replaces the bad value with a corrected one, typically interpolated from surrounding bars or reconciled against a second feed. This suits stale-bar runs and confirmed bad prints where you know what the price should have been. It's more labor intensive than removal but preserves the timestamp grid, which matters for any strategy sensitive to bar count or sequence.
Winsorization, capping extreme values at a percentile boundary rather than removing or replacing them, is common in general statistical work but poorly suited to price data on its own. Capping a genuine spike at some arbitrary ceiling distorts the very volatility a strategy is trying to trade, and it's rarely how professional data vendors handle intraday market data. Where it does show up usefully is in secondary analysis, like capping outlier slippage estimates when building a cost model, rather than in the core price series itself.
For M1 datasets meant for backtesting, removal of confirmed bad ticks paired with documented adjustment of stale runs is the combination that preserves both data integrity and the timestamp grid your Strategy Tester depends on.
Setting Thresholds for Outlier Detection Without Losing Real Volatility
The hardest part of outlier detection isn't the math. It's picking a threshold that catches errors without deleting real market behavior, and that threshold has to flex with the instrument and the session.
A Z-score cutoff of three standard deviations might be reasonable for a major forex pair during London hours, where liquidity is deep and genuine three-sigma moves are rare outside news events. Apply that same cutoff to a thinly traded exotic pair or a stock index during the Asian session, and you'll flag normal price behavior as outliers constantly, since the baseline volatility is naturally wider and noisier.
Session-aware thresholds matter more than a single global rule. Set tighter bounds during high-liquidity windows, where a spike is more likely to be a genuine bad print, and looser bounds around scheduled news releases and market opens, where real volatility spikes are expected and shouldn't be scrubbed out.
Stale-bar thresholds need the same situational logic. Ten consecutive flat bars during Tokyo lunch hour on a minor pair might be normal. The same run during New York's open on a major pair is almost certainly a feed problem. Set your defect threshold by session and instrument liquidity, not as one flat number applied everywhere.
Whatever threshold you choose, document it alongside the dataset. A cleaning rule that isn't written down can't be audited, and a threshold you can't explain to another quant reviewing your results isn't one you should trust with your own capital either.
Outlier Handling Across Asset Classes: Forex, Indices, and Bonds
Outlier behavior isn't uniform across instruments, and a cleaning rule tuned for one asset class can misfire badly on another.
Forex majors trade nearly continuously with deep liquidity, so genuine outliers are usually confined to scheduled news windows and rare geopolitical shocks. A bad tick outside those windows is almost certainly a printing error, which makes forex the easiest asset class to clean with confidence.
Stock indices carry structural gaps that forex doesn't: overnight sessions, pre-market thin liquidity, and the discontinuity between one day's close and the next day's open. A cleaning pipeline built for forex will misclassify a normal index opening gap as a data defect if it isn't taught the difference between a session boundary and an actual error.
Commodities and metals sit somewhere in between, with liquidity that can thin out sharply around specific delivery windows or macro data releases tied to inventory reports. Bonds and back-adjusted futures data introduce another layer entirely: contract rolls create artificial price jumps that have nothing to do with market volatility and everything to do with switching from one expiring contract to the next. Cleaning back-adjusted futures data requires handling the roll adjustment separately from genuine outlier detection, or you'll end up scrubbing a legitimate roll-driven jump as if it were a bad tick.
Automating Outlier Detection in a Data Pipeline
Manual spot-checks work for a handful of instruments. They fall apart the moment you're maintaining datasets across a dozen forex pairs, several indices, and a metals bundle, all updating on a rolling basis. Automation is the only way to keep cleaning consistent at scale.
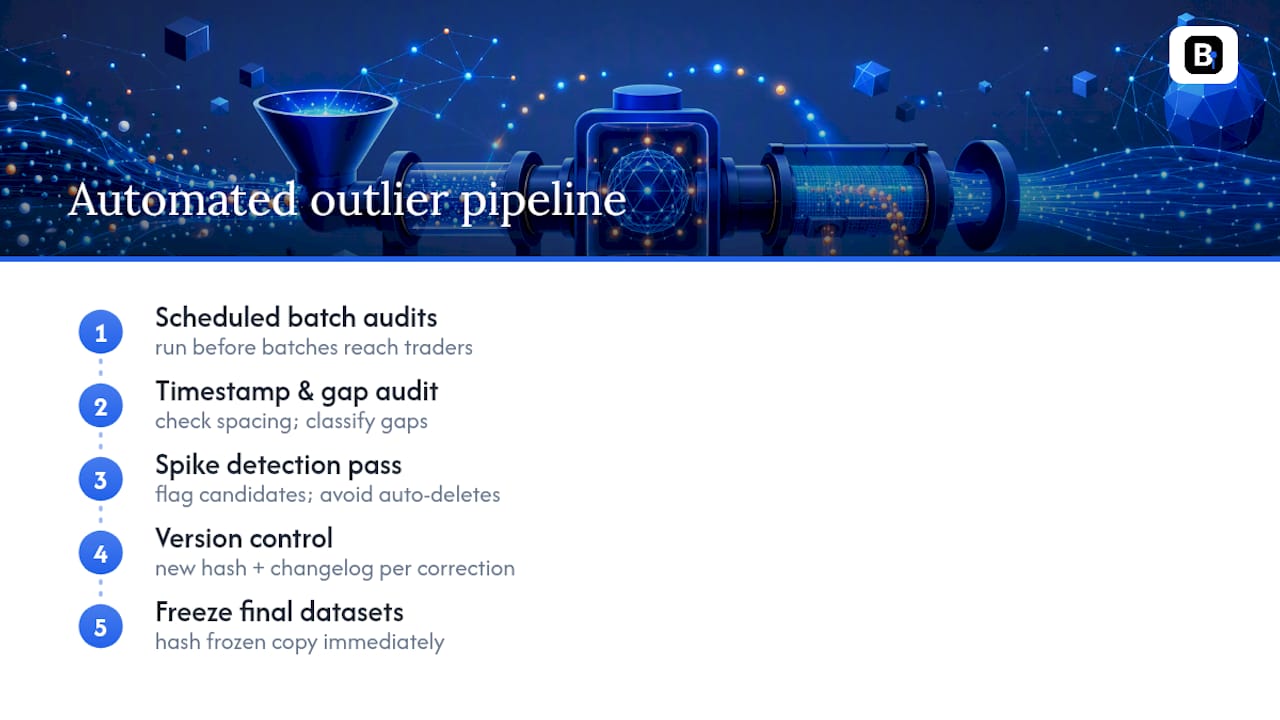
A solid pipeline runs the timestamp-spacing audit and gap classification as a scheduled job on every new data batch, before the batch ever reaches a trader's desktop. Spike detection should run as a second automated pass, flagging candidates for review rather than auto-deleting anything outright, since an automated system will occasionally misclassify a genuine volatility event as an error.
Version control matters as much as the detection logic itself. Every corrected file needs a new hash and a changelog entry describing exactly what was altered and why, so nobody downstream is left wondering whether last month's dataset and this month's are actually the same file with a different filename. Readers building or auditing their own pipeline can get a lightweight look at automated flagging logic through outlier detection tooling built for spreadsheet-based workflows, useful as a sanity check on a smaller dataset before committing to a full engineering pipeline.
The single most important automation habit, though, has nothing to do with detection logic: freeze and hash every dataset version the moment it's finalized. Vendor-side revisions happen, and without a frozen, hashed copy, you have no way to prove which file produced which backtest result six months from now.
Why Backtestmarket Builds Outlier-Handled Datasets This Way
Backtestmarket has been producing clean minute-bar datasets since 2014, and that history shapes how we think about this problem. Phantom highs and stale-bar runs don't just look bad in an audit report, they quietly inflate the perceived edge of mediocre strategies and cost traders real capital before they ever go live.
Every bundle ships with per-year gap reporting and a dataset hash so you can verify nothing changed underneath you between download and deployment. Our engineers answer support questions directly, not through a ticket queue, because a data question at 2 AM before a live deployment deserves a real answer. Inspect the sample audit reports and import guides before you buy anything. That transparency is the point.
— Start
Get Audited M1 Datasets Ready for MT4 and MT5
Backtestmarket sells the exact thing this article just walked you through auditing yourself, minus the hours of scripting. Every bundle ships as an all-in-one download with per-year gap reports, documented spike and stale-bar corrections, and a dataset hash you can check against your own copy before you trust a single backtest run.
Bundles cover forex, metals, stock indices, bonds, and commodities, all formatted for direct MT4 and MT5 import with the bid/ask/spread fields your Strategy Tester actually needs for real-tick modeling. Browse the full historical data catalog to see sample audit reports before you commit, or head straight to the product page to find the specific instrument and timeframe your strategy needs.
Sources
- Fortraders
- Optimize EA backtest quality using real ticks — Huttertrade
- OHLC interpolation: why MT4/MT5 fabricates your backtest fills — FX Strategy Analyzer
- Backtesting data quality: can your data provider be trusted? — Concretum Group
- Trust your backtest data first: Building a reproducible historical data audit in Python for MetaTrader 5 — MQL5 Articles
Recommended
- Minute Bar Data: What Quants Need for Reliable Backtests
- Data Snooping Bias: How Researchers and Quants Catch It
- How to Import Data in MetaTrader (MT4 / MT5)
- Holiday Gaps in Market Data: A Quant's Handling Guide
Related resources
Explore BacktestMarket's Expert Advisor robots to put the ideas in this article into practice.