

Pairs trading on minute bars works only when both legs of the spread share the same clean, time-aligned, consistently adjusted history. One bad bar on one leg creates a fake spread, and a fake spread creates a fake trade in your backtest. We build minute-bar sets for forex, metals, bonds, stock indices and commodities, delivered as one complete download that imports into MT4 and MT5. Below is what the data must contain, how to test pairs, and where backtests usually go wrong.
TL;DR
- Pairs trading bets that the spread between two related instruments reverts to its historical equilibrium. The spread is computed from both legs, so a defect in either leg corrupts the signal.
- Minute data needs matching timestamps, a rule for missing bars, adjusted contracts for futures, and a documented cleaning step before any cointegration test.
- Screen candidate pairs first with a distance measure, then confirm with a cointegration test such as Engle-Granger.
- Model transaction costs and use only information available at the time of each bar, or the backtest will overstate results.
- A single complete download for each asset class keeps both legs consistent and ready for MT4 and MT5.
Table of Contents
- What pairs trading asks of your data
- What minute data you need per instrument
- Which pairs are worth testing
- Cleaning minute bars before you trust a spread
- Backtesting without fooling yourself
- A worked example of the workflow
- Where to get the data and what to check
- Our perspective
- Get both legs from one source
- FAQ
- Sources
What pairs trading asks of your data
Pairs trading is a statistical arbitrage strategy. You go long the instrument that looks undervalued, short the one that looks overvalued, and expect the spread to return to its historical equilibrium. Academic work traces it to a group of mathematicians, physicists and computer scientists at Morgan Stanley in the mid-1980s, with the first academic publication by Gatev and colleagues in 1999.
The idea is simple. The data demands are not. Every signal comes from a relationship between two series, so you need:
- Two histories on one clock. Timestamps must refer to the same time zone and the same session logic on both legs.
- Comparable bar construction. Both legs must be built the same way, from the same kind of prices.
- Enough history to cover different regimes. A spread that behaves in a calm year may break in a volatile one.
- A documented treatment of gaps and adjustments. You need to know what was changed, or you cannot tell a market event from a data artifact.
Why minutes? Shorter bars give you more observations, faster signals and a view of how spreads behave inside the day. A 2023 study in the Journal of Innovation and Knowledge argues that high-quality data plays a vital role in algorithmic trading. It tests a high-frequency pairs strategy on minute-level data for 47 commodity futures, using cointegration tests, ADF stationarity tests, Kalman filter regression and a Hurst index evaluation. The workflow is demanding precisely because small data errors compound across all of those steps.
What minute data you need per instrument
For each leg you need, at minimum, open, high, low, close and volume for every minute bar, with a reliable timestamp. Closes drive most spread calculations, but highs and lows matter for judging whether a fill at your signal price was realistic.
A useful reference point comes from a study of minute-by-minute S&P 500 constituent prices from 1998 to 2015. It uses 391 minute data points per stock per day, aggregates ticks into minute values, and assigns the previous price when a stock did not trade in a given minute. That last rule matters. Forward-filling a quiet minute keeps both series the same length, but it also makes illiquid instruments look more stable than they are.
Two practical consequences follow.
- Decide how to treat empty minutes before you test, not after. Forward-filling, dropping the minute from both legs, or dropping the whole session are all defensible. Mixing them across pairs is not.
- Match sessions, not just clocks. An index that trades only during cash hours and a metal that trades nearly around the clock overlap only for part of the day. Run the spread only inside the overlap, or you are measuring one leg against a stale price.
If you want to see how session timing changes the picture, our note on engineered intraday correlation shows how correlation shifts through the trading day.
Which pairs are worth testing
Before you run anything heavy, narrow the field. With a few hundred instruments, the number of possible pairs explodes, and you will find spurious ones by chance. A two-stage approach is standard.
Stage one: prescreen by distance
The Palomar portfolio optimization text describes prescreening with the normalized price distance: the sum of squared differences between normalized prices. Pairs with a small distance moved together over the window, so they are candidates, not conclusions.
Stage two: confirm with cointegration
The same chapter explains that a cointegration test checks whether a linear combination of two series follows a stationary autoregressive model, which means the spread should be mean reverting. The Engle-Granger test has two steps. First, estimate the hedge ratio, called gamma, by least squares regression. Then test the residual for stationarity.
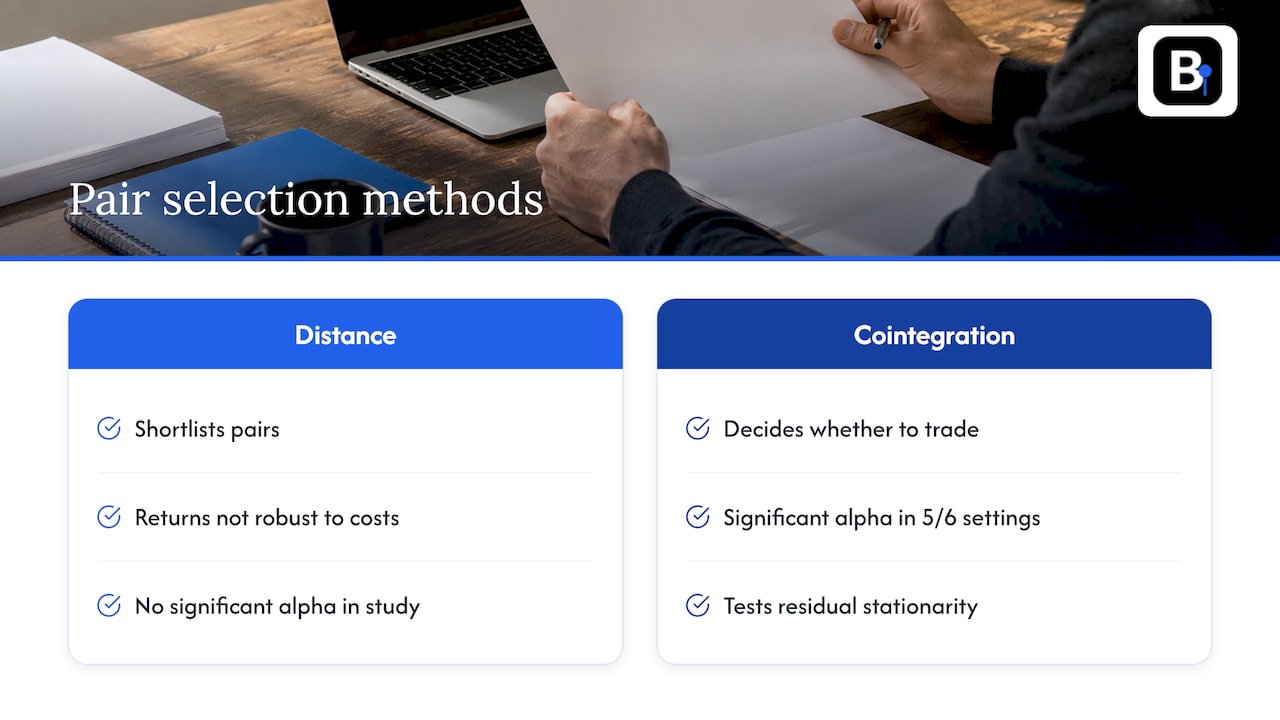
The choice of method matters for results. A Copenhagen Business School master's thesis on ETF pairs covering 2006 to 2020 found that the cointegration method produced statistically significant alpha in five of six trigger settings. The distance method did not, because its returns were not robust to transaction costs. In practice, use distance to shortlist and cointegration to decide.
Pair ideas by asset class
In the markets we cover, natural relationships include:
- Stock indices from related economies or sectors, where the same macro drivers act on both.
- Metals, such as gold against silver, where industrial and monetary demand overlap.
- Forex crosses that share a base or quote currency.
- Bond and index spreads, where rate expectations feed both legs.
These are starting points for testing, not guarantees. Every one needs the stationarity check above on your own sample.
Cleaning minute bars before you trust a spread
A spread amplifies errors. If one leg has a single bad print, the spread jumps, the z-score crosses your entry threshold, and the backtest books a profitable reversion that never existed in the market. Clean before you test.
The main problems to handle:
- Spikes and bad ticks. An isolated price that jumps away from its neighbors and snaps back. Our post on a three-condition spike test lays out a rule for flagging them.
- Missing bars. Decide on fill or drop, and apply the same rule to both legs.
- Rollovers on futures. Raw contract chains contain price gaps at each roll. Those gaps look like instant spread moves. Back-adjusted series remove the gap so that returns across the roll are continuous.
- Session differences. Daylight saving shifts and holiday schedules can move bars by an hour on one leg but not the other.
- Undocumented adjustments. If a vendor changes values, you should be able to see how and why.
This is where buying a finished set changes your workload. Our own standard is bar-by-bar verification and documentation of adjustments, and we maintain the sets so they remain compatible with MT4 and MT5. That means the hours you would otherwise spend writing cleaning code go to the research itself.
Backtesting without fooling yourself
The pairs literature is full of spectacular numbers. The minute-level S&P 500 study reports that its best strategy produced 50.50% annual returns and an annualized Sharpe ratio of 8.14 after transaction costs, over 1998 to 2015 (source). Read that as a demonstration of what careful, data-hungry research can look like, not as a benchmark for your own results. What is worth copying is the discipline behind it:
- Use only information available at the time. The paper restricts every decision to data known at that moment, which removes look-ahead bias.
- Remove survivorship bias. It used daily constituent lists and complete tick history rather than today's list of survivors.
- Charge costs on every trade. It applied 5 basis points per share per half-turn, and it did not model further market impact.
For a pairs trader, each of those has a concrete form.
Look-ahead bias
The classic mistake is estimating the hedge ratio or the spread mean on the full sample, then trading it from the start. Estimate on a trailing window, or on a training period, and trade on a later period. A student project that clusters S&P 100 minute panels to build a pairs strategy makes avoiding look-ahead bias and data leakage an explicit goal, alongside handling missing values and estimation noise. Our article on avoiding look-ahead bias with index intraday data covers how timestamps and bar closes can leak the future.
Costs and slippage
Pairs trades have two legs, so you pay twice on entry and twice on exit. Minute strategies trade often, so small costs add up quickly. Set a cost per leg that reflects your venue's spread and commission, then test how much the result shrinks when you double it. If the edge disappears, it was never an edge.
Sample length
A minute-bar test with too little history can be misleading. Twenty thousand bars sounds large but covers only about ten weeks of intraday trading, as we explain in this note on intraday history length. Pairs relationships drift, so you want years that include calm and stressed markets.
Position management
Once the entry logic is sound, exits and sizing decide whether it survives. Rules for trade management strategies such as risk per trade apply to each leg of a spread just as they do to a single position, so define your stop on the spread, not on one leg.
A worked example of the workflow
Here is the sequence applied to two hypothetical related index series. The numbers are illustrative of the method only.
- Load a minute-bar history for both from the same source and confirm they cover the same date range and time zone.
- Restrict to the hours when both markets are open.
- Run the spike test and drop or repair flagged bars in the same way for both legs.
- Normalize prices and compute the distance over a formation window, for example the first twelve months.
- For the closest pairs, run Engle-Granger: regress one on the other for the hedge ratio, then test the residual for stationarity.
- Over the next window, trade only the pairs that passed, using the hedge ratio fixed from the formation period.
- Enter when the spread's z-score crosses your threshold and exit when it returns toward its mean, with costs charged on both legs at each trade.
- Roll the windows forward and compare results across periods.
If step 3 is skipped, steps 4 to 7 are working on a contaminated spread. That is why data quality sits first in the process, not last.
Where to get the data and what to check
Traders usually choose among a few types of source: free feeds, brokers' platform histories, exchange or official data, and specialist vendors of cleaned sets. Whatever the type, check the same things:
- Coverage. Which instruments and how many years of minute history?
- Construction. Bid, ask or trade prices? How are bars built and time-stamped?
- Gaps and corrections. Are missing bars and bad ticks handled, and is that documented?
- Futures treatment. Is there a back-adjusted series, and how is the adjustment described?
- Format. Can it be imported straight into your platform, or do you need conversion scripts?
- Licensing. What are you allowed to do with the files, including in software you build?
Our guides on auditing intraday data sources and on forex minute data for MT4 and MT5 walk through these checks in more detail, and the Nasdaq intraday data note covers specifications for that market.
Our perspective
Most failed pairs backtests we hear about do not fail on the statistics. They fail on the inputs: two legs built differently, a rollover gap read as a signal, a handful of bad bars that happen to line up with the trades that made the equity curve look good.
That is why we deliver minute-bar data as a complete, clean set since 2014 rather than as a feed you must patch. Our engineers collect the data, verify it bar by bar and document adjustments, so that you can see what was done to the series you are testing. We hold the same standard whether a human or an AI model runs the backtest, because a model is only as honest as the history it reads.
Pairs trading rewards consistency across legs. A single source, one format and one cleaning standard across forex, metals, bonds and stock indices means your spread reflects the market and not a mismatch between files. If a question comes up on a specific series, you can reach the engineers who prepared it.
Start
Get both legs from one source
If you are building a pairs strategy on minutes, start with the Historical Data page. Every set is a one-time download, covers minute bars since 2014 and is ready to import into MT4 or MT5. Bundles by asset class let you pull both legs of a spread in the same format, and back-adjusted futures data is available where rollovers matter.
The Annual Plan costs €119 per year. If you also run automated portfolios, our Expert Advisors and Indicators are on the main site.
FAQ
How much minute data do I need for pairs trading?
Enough to cover several market regimes, which usually means years rather than weeks. A pair can look cointegrated in one calm window and break in the next, so you want formation and trading periods that are both long enough to compare. Minute bars give many observations quickly, but the number of independent market conditions grows only with calendar time.
Is cointegration better than correlation for choosing pairs?
They answer different questions. Correlation says two series move together in direction. Cointegration tests whether a combination of them is stationary, meaning the spread tends to revert, which is what the strategy needs. The ETF thesis cited above found the cointegration method delivered significant alpha in most settings, while the distance method did not hold up after costs.
Should I forward-fill missing minute bars?
It is acceptable if you apply it consistently to both legs and understand the effect. The minute-level S&P 500 study assigns the previous price when a stock did not trade in a minute. The risk is that quiet instruments look steadier than they are, so you may prefer to drop minutes where either leg is empty.
Can I run a minute-level pairs strategy in MT4 or MT5?
Yes, provided you have clean minute history for both instruments loaded into the platform. Our data sets are built for direct import into both, so you can test spreads there without conversion steps. Keep the spread logic and its costs explicit in your expert advisor.
Sources
- Statistical Arbitrage Pairs Trading with High-frequency Data
- Discovering Cointegrated Pairs, Portfolio Optimization
- SP100 high-frequency analysis, correlation clustering and trading
- An innovative high-frequency statistical arbitrage, Journal of Innovation and Knowledge
- Master thesis: Pairs trading on ETFs
Recommended
- Quants: 3 Places to Download Verified OHLCV Minute Data
- Tick vs Minute Data: Which One Your Backtest Needs
- Forex Daylight Saving Time: Fixing DST Errors in Minute Data
- Quant Traders: One Line Fill Formula to Simulate Minute Bar Slippage
Related resources
Explore BacktestMarket's Expert Advisor robots to put the ideas in this article into practice.