

To backtest position sizing, hold your entries and exits constant, change only the size rule, and compare the resulting equity curves, drawdowns and risk per trade. Then add the constraints a live account would impose: margin, lot increments, costs and overlapping positions. Most backtests skip that last step, which is why many sizing rules look better on paper than they ever behave in production.
This guide covers the formula, the main sizing methods, how to test them independently of your signal, and the data and cost assumptions that decide whether your result can be trusted.
TL;DR
- Position size is the number of units you trade. The core formula is account risk divided by trade risk per unit, so the size rule changes your risk and return as much as the signal does.
- Start with fixed size and one position at a time to get clean baseline metrics. Then add percent-of-equity, risk-based and volatility-based sizing one at a time.
- Test the size rule on identical entries and exits, and enforce margin, lot size and portfolio exposure limits in the engine.
- Costs, slippage and data errors distort sized results more than unsized ones, because larger positions magnify every flaw in the tape.
- Hypothetical results are not a forecast. Treat them as a stress test of your rule, not a promise.
Table of Contents
- What position sizing is and the formula behind it
- Notional size is not the same as risk
- The main position sizing strategies you can test
- How to test sizing independently of the signal
- Build the constraints a real account has
- Costs, slippage and execution assumptions
- Why data quality changes sizing results
- Our perspective
- Reading results without fooling yourself
- Data to run these tests on
- FAQ
- Sources
What position sizing is and the formula behind it
Position sizing is the process of deciding how many units of a security to buy or sell, and it directly shapes both risk and potential return. Two traders with the same entry signal can end up with very different outcomes because one risks 0.5% per trade and the other risks 3%.
The standard formula is simple: position size equals account risk divided by trade risk per share, where account risk is usually a percentage of capital. If you have $50,000, risk 1% ($500) per trade, and your stop sits $2.50 below entry, you buy 200 shares.
In forex the same idea needs pip values. A common version is account value times risk per trade, divided by pips risked, divided by pip value per standard lot. With $10,000, 1% risk, a 50-pip stop and a pip value of $10 per standard lot, you get 0.2 lots. If you trade through a platform with a lot-size panel, a walkthrough on calculating lot size shows the same arithmetic applied to execution.
That formula is the live version. A backtest has to reproduce it bar by bar, using only information available at the time of each trade.
Notional size is not the same as risk
A frequent beginner error is to treat a $20,000 position as a $20,000 risk. It is not. Risk is what you lose if your exit is hit, and that depends on the stop distance. A $20,000 position with a 1% stop risks $200. A $5,000 position with a 10% stop risks $500.
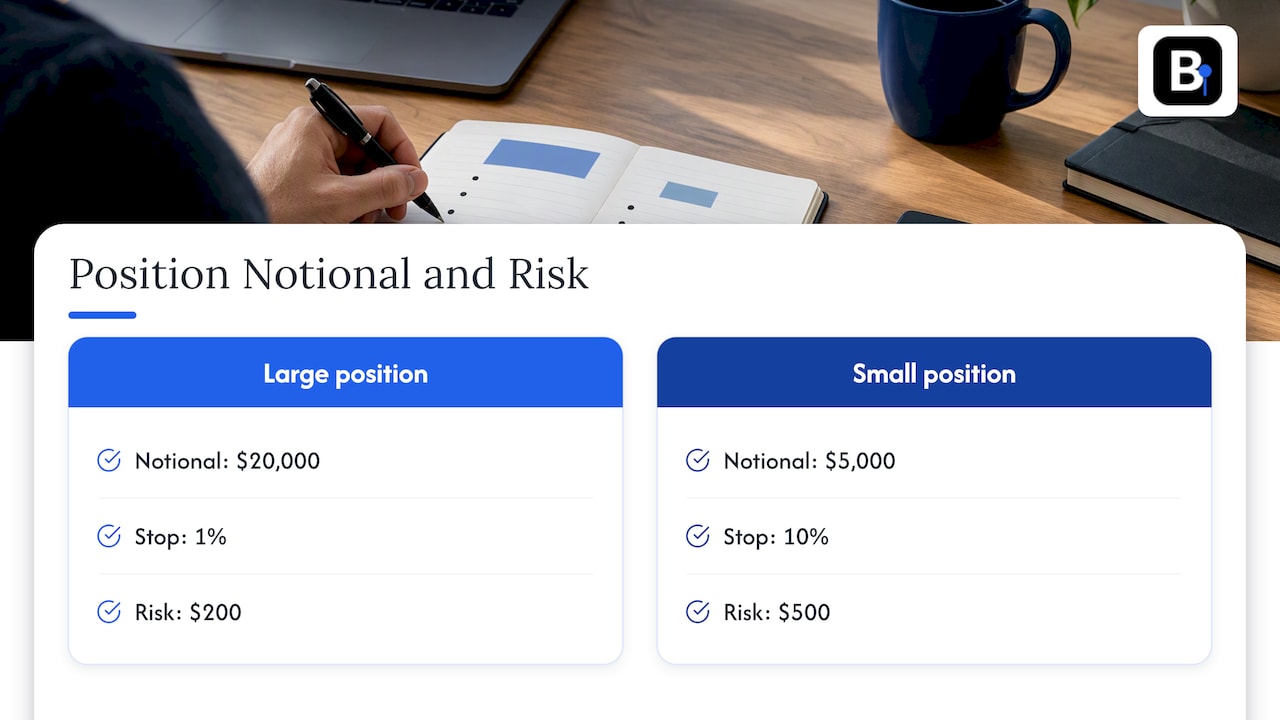
This matters for backtesting because many engines report exposure in notional terms. If you compare strategies by notional, you may conclude one is "bigger" when it is actually safer. Record both numbers for every trade: notional exposure and risk to the stop. Then you can check whether your rule really delivers the risk per trade you meant it to.
The main position sizing strategies you can test
The common approaches fall into four families. Fixed-quantity, fixed-dollar, percentage-of-equity and risk-based sizing differ mainly in how they treat risk as the account changes.
| Method | Rule | Strength | Weakness |
|---|---|---|---|
| Fixed quantity | Always trade the same units or lots | Easiest to audit; clean baseline | Risk drifts as price and volatility change |
| Fixed dollar | Always allocate the same capital | Equalizes capital across instruments | Ignores stop distance and volatility |
| Percent of equity | Allocate a share of current equity | Scales with the account | Can still overrisk in volatile markets |
| Risk-based | Size so a stop-out costs a fixed percent | Keeps risk per trade constant | Needs a defined stop for every trade |
| Volatility-based | Size inversely to ATR or similar | Adapts to market conditions | Depends on the volatility window you pick |
Fixed methods give simplicity but inconsistent risk exposure. Percentage and risk-based methods scale automatically with the account, though a percent rule can still produce excessive risk when it ignores volatility, which is why layered risk controls help.
Fixed size: your baseline
Before anything else, run the strategy with one fixed size and one position at a time. This is also the advice many practitioners give in algo trading communities: get clean performance metrics first, then layer in complexity such as compounding. If the signal cannot show an edge at constant size, no sizing wrapper will honestly create one.
Percent of equity and compounding
Percent-of-equity sizing compounds. Winning streaks grow the position, losing streaks shrink it. That is realistic, but it makes the end of the test dominate the result: the biggest positions occur late, so the final few trades carry a disproportionate share of the profit.
Track this explicitly. Report results at several starting points, or compare compounding against a non-compounding run. If the compounding curve looks spectacular only because of one late period, the rule is more fragile than the headline suggests.
In forex, decide whether sizing uses balance or equity. Equity includes open-position gains and losses, so equity-based sizing reacts to unrealized moves, while balance-based sizing reacts only to closed trades. Pick one, document it, and keep it the same across every run you compare.
Fixed ratio and its time-weighting problem
Fixed-ratio sizing adds units as profits grow, which can create larger drawdowns. There is a second, subtler issue raised by traders discussing it: contracts added later see less of the test period, so expectancy is not measured on an even time basis. The practical fix is to report per-unit results alongside dollar results.
Volatility-based sizing
Volatility sizing makes risk per trade stable across calm and turbulent markets. A typical version uses Average True Range (ATR): choose the size so that a one-ATR move costs a fixed fraction of the account, such as 1%. Size falls as ATR rises, which reduces exposure in high-volatility environments.
A worked example: account $100,000, target 1% risk per one-ATR move, so $1,000. If a stock's ATR is $4, you buy 250 shares. If volatility doubles and ATR becomes $8, the same rule buys 125.
There is academic support for the idea. A 2014 KTH master's thesis on position sizing for a trend following CTA found that Target Volatility, and to some degree Max Drawdown Minimize and Dynamic Stop Lock-In, improved strategy performance. That is one study of one strategy family, so use it as a reason to test, not as proof for your own system.
The parameters you must pick, and therefore must test for sensitivity, are the ATR lookback and the risk multiple. Run a small grid and look for a plateau of reasonable results rather than a single sharp peak.
How to test sizing independently of the signal
A sizing test is only meaningful if the signal is frozen. The approach is straightforward:
- Generate the entry and exit list once, with timestamps and stop distances.
- Apply each sizing rule to that identical list.
- Compare results across rules, not across signals.
Tools that support this, such as Python backtesting frameworks that size by units, cash, percent of equity or risk, let you swap the size type while keeping the same entries and exits, then compare things like losing-trade P&L and portfolio value curves.
What should you compare? A short list is enough:
- Maximum drawdown and drawdown duration
- Worst single-trade loss as a percent of equity
- Return divided by drawdown
- Distribution of risk per trade, not just the average
- Largest simultaneous exposure
If a sizing rule raises return but doubles the worst drawdown, you have not found an improvement. You have found more leverage.
Build the constraints a real account has
Sizing rules that ignore constraints produce trades nobody could place. Four constraints cause most of the trouble.
Cash and margin. When a trade exceeds available margin, the protocol has to define whether to skip the trade or shrink it to fit remaining capital. Either choice is defensible. Leaving it undefined is not, because strategies that look profitable on paper may be impossible to execute if they break margin limits during volatile stretches.
Lot sizes and increments. A formula that says 0.137 lots may round to 0.13 or 0.14 on a real platform, and for small accounts or expensive futures contracts that rounding can swing risk by double digits. Round in the backtest the same way your broker does, and round down, not to nearest.
Reversals. If your system flips from long to short, the order has to close the old position and open the new one. Size the new leg from post-close equity and charge costs on both legs.
Portfolio exposure. Per-trade risk is not portfolio risk. Five trades at 1% each in highly correlated instruments behave like one trade at close to 5%. Set a cap on total open risk and on exposure to correlated groups. Our walkthroughs on multi-symbol backtesting and MT4 portfolio backtesting show how to find the real drawdown when several instruments run together.
A practical overview of how a 1% rule works across a full set of holdings is in this piece on 1% risk position sizing for a diversified portfolio.
Costs, slippage and execution assumptions
Costs hit sized strategies unevenly. A fixed-size test might survive a spread assumption that breaks a volatility-sized one, because the latter often trades larger precisely when spreads are widest.
A realistic protocol specifies signal timing, execution, costs, constraints, data availability and benchmarks, and it tests for look-ahead, survivorship and data-snooping bias. It also varies spread, slippage and impact to find the break-even level, the cost at which your edge disappears. Cost models range from a flat spread to linear slippage and a square-root impact model.
Costs are also not constant. They vary with market state, so parameters are best estimated separately by volatility bucket and trading window. That is directly relevant to volatility sizing: your biggest trades in calm markets and your smallest in storms face different cost regimes, and a single average cost will misprice both.
For the mechanics, see our posts on transaction costs in backtesting, spread modeling and a slippage formula for minute bars.
Two more execution points matter for sizing specifically:
- Size from information you had. If the size depends on ATR or equity, compute it from the bar before the entry, never the bar that contains it. Our guide to catching look-ahead bias covers this leak.
- Fill at the size you can fill. On thin instruments or overnight gaps, a large position will not execute at the bar's price. Cap size at a fraction of typical volume where volume data exists.
Why data quality changes sizing results
Sizing amplifies data problems. A missing bar, a stale quote or a bad spike can set an absurd ATR, which then produces an absurd position, which then dominates the equity curve. Risk-based sizing is especially sensitive because the stop distance sits in the denominator: a falsely tight range inflates size.
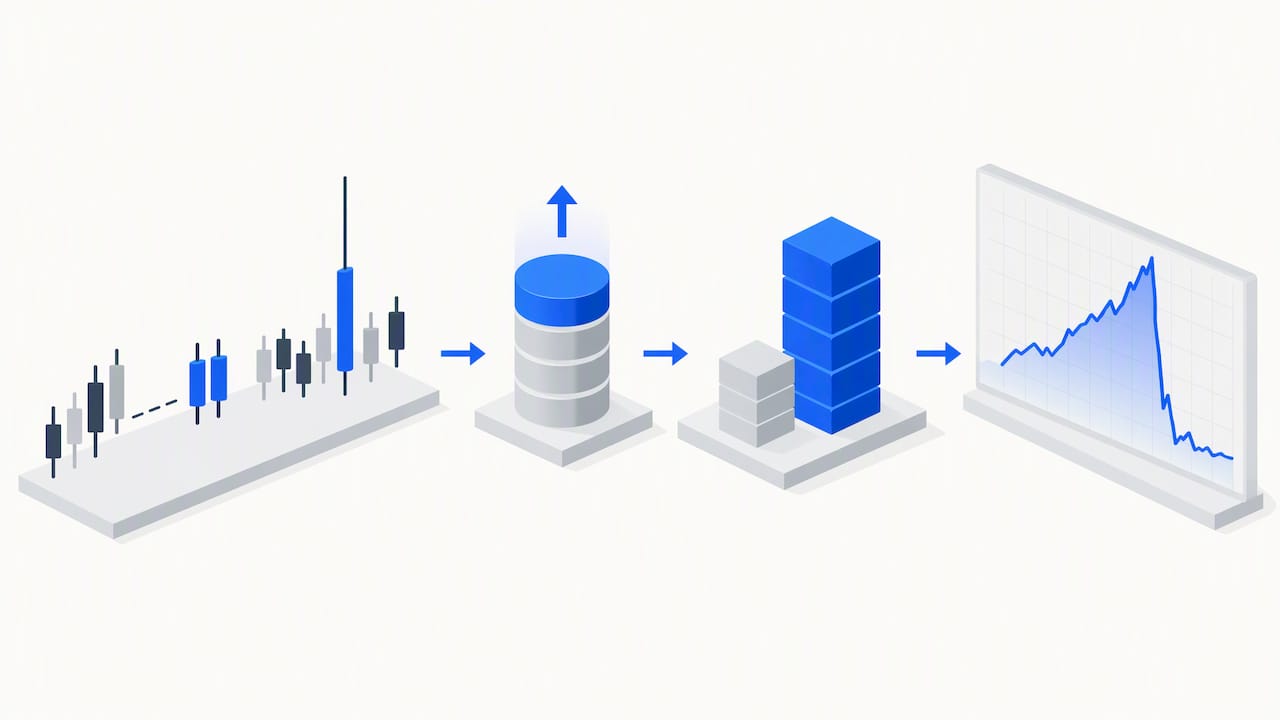
So before tuning any size rule, audit the bars: gaps, duplicate timestamps, outlier ticks, session boundaries, and how rollovers are handled for futures. Minute-bar data lets you model intraday stops and slippage far more faithfully than daily bars, because you can see whether the stop or the target was touched first inside a day.
Our perspective
We collect and maintain minute-bar data, and the support questions we get from quant traders follow a pattern. People tune the sizing formula for weeks, then discover the best-looking result came from a handful of bars that were wrong. The sizing rule was working perfectly. The input was not.
Our view is that sizing research should go in a strict order. First, verify the data bar by bar and document any adjustments. Second, run a fixed-size baseline. Third, add one sizing idea at a time, each on the same frozen entries and exits. Fourth, add costs and constraints, and see what survives. A rule that only works in the frictionless version is not a rule.
The same standard applies whether a human or an AI model is writing the strategy. Generated code can produce a convincing sizing function that quietly uses future information or ignores margin, and only clean data plus explicit rules will expose it. For a deeper look at checking robustness, our posts on out-of-sample testing and walk-forward analysis show how to confirm that a sizing parameter holds up on data it was not tuned on.
— Start
Reading results without fooling yourself
Finish by stress testing the sizing assumptions themselves. Halve and double your risk percentage. Change the ATR window. Start the test in different years. Remove the best 5% of trades. If the conclusion flips, it was not a conclusion.
Keep the claim modest, too. Hypothetical results are built with hindsight, and even large institutions say so: a J.P. Morgan index supplement filed with the SEC in 2026 notes that backtested performance often uses hindsight-biased models and does not guarantee future results. Your backtest is evidence about how a rule behaves under assumptions, not a forecast of returns.
Also remember that fixed-exposure rules can matter beyond your own account. The BIS has documented how systematic rebalancing by leveraged ETPs, which hold fixed target exposure, can worsen volatility spikes when it forces large trades at the close. If your rule re-levers into falling markets, ask whether your fills would be as good as the backtest assumes at exactly that moment.
Finally, write the complete rule down: risk percent, stop definition, volatility window, rounding, margin handling, correlation cap, and compounding choice. If you cannot write it in a paragraph, you cannot reproduce it.
Data to run these tests on
If you want to run these tests on clean minute-bar history, our Historical Data page covers forex, metals, stock indices, bonds and commodities since 2014, delivered as complete datasets you can import into MT4 and MT5. For index futures work, the S&P 500 Back Adjusted 1mo set is a good place to test volatility-based sizing across contract rolls. Our Annual Plan is €119 per year, and engineers who collect the data answer support questions directly.
FAQ
What is the formula for position sizing?
Position size equals the amount you are willing to risk divided by the risk per unit, which is the distance from entry to stop. If you risk $500 and the stop is $2.50 away, you trade 200 shares. In forex, divide by pips risked and pip value per lot instead.
Which position sizing method should I backtest first?
Start with fixed size and a single position at a time, so you can see the raw behavior of the signal. Then test percent-of-equity or risk-based sizing on the same entries and exits. Add volatility-based sizing last, because it introduces extra parameters that need sensitivity testing.
Does volatility position sizing improve backtest results?
It can steady risk per trade, and one academic thesis on a trend following strategy found target-volatility sizing helped performance. Results depend on the strategy, the volatility window and costs, so confirm it on out-of-sample data before relying on it.
Can I test position sizing separately from my entry signal?
Yes, and you should. Freeze the list of entries, exits and stop distances, then apply each sizing rule to that list. Any difference in drawdown or return then comes from the size rule alone.
Sources
- Position sizing, Investopedia
- The Position Size, FXStreet Learning Center
- Position Sizing in a Backtest, Pomegra
- Backtesting with Fixed Size vs Fixed Ratio, Elite Trader
- Position sizing methods for a trend following CTA, KTH
- Position sizing: fixed, percent, and risk-based, VectorBT PRO
- Strategy Simulation, ML for Trading
- Transaction Costs, ML for Trading
- Passive funds affect prices, BIS Working Paper 952
- The equity market turbulence of 5 February, BIS Quarterly Review
- J.P. Morgan index supplement, SEC filing
- 1% risk position sizing strategy, StockPilot
- How to calculate a lot size, Key-Trade
Recommended
- Monte Carlo Backtesting: How to Stress-Test a Strategy
- Out-of-Sample Testing: How to Validate a Trading Strategy
- Spread Modeling for Backtests: 3 Estimators to Stress Test ML Edge
- Transaction Costs for Quants: Test 3 Regimes, Watch Engine Risk
Related resources
Explore BacktestMarket's historical data packs to put the ideas in this article into practice.