

Price precision in backtesting is how faithfully your test reproduces the prices a strategy could actually have traded at. It covers two things: how the engine simulates price movement inside each bar, and how accurate the stored historical prices are. Get either wrong and a profitable-looking equity curve can be an artifact of the data or the simulation, not of your edge.
TL;DR
- Precision has two layers: the simulation mode (bar-only, 1-minute, or real tick) and the quality of the underlying price history.
- Stop and limit orders need finer simulation than market orders, because fills depend on the path price took inside the bar.
- Validate data before tuning: check timestamps, duplicates, OHLC logic and gaps, and never forward-fill missing bars blindly.
- Model spread, commission and slippage explicitly. Run every test with and without costs.
- Stress the result: vary parameters, costs and periods. A broad plateau is better evidence than a lone peak.
Table of Contents
- What price precision means in a backtest
- Choosing the right precision level for your strategy
- Check the data before you tune anything
- Model costs and fills honestly
- Stress the result with sensitivity analysis
- Where backtests and live trading part ways
- Our perspective
- Start with clean data
- FAQ
- Sources
What price precision means in a backtest
A backtest does not watch a market. It replays stored numbers and decides, bar by bar or tick by tick, which orders would have filled and at what price. "Precision" is the resolution of that replay.
StrategyQuant's documentation shows the clearest ladder of modes. In its data settings, the Selected Timeframe mode uses only the main timeframe and creates four ticks per bar (open, high, low, close). The 1 Minute mode builds four ticks every minute from minute data. The two Real Tick modes use recorded ticks, with either a custom spread or the real bid and ask. The same documentation says the bar-only mode is usually sufficient for market orders, while tick simulation suits stop and limit orders.
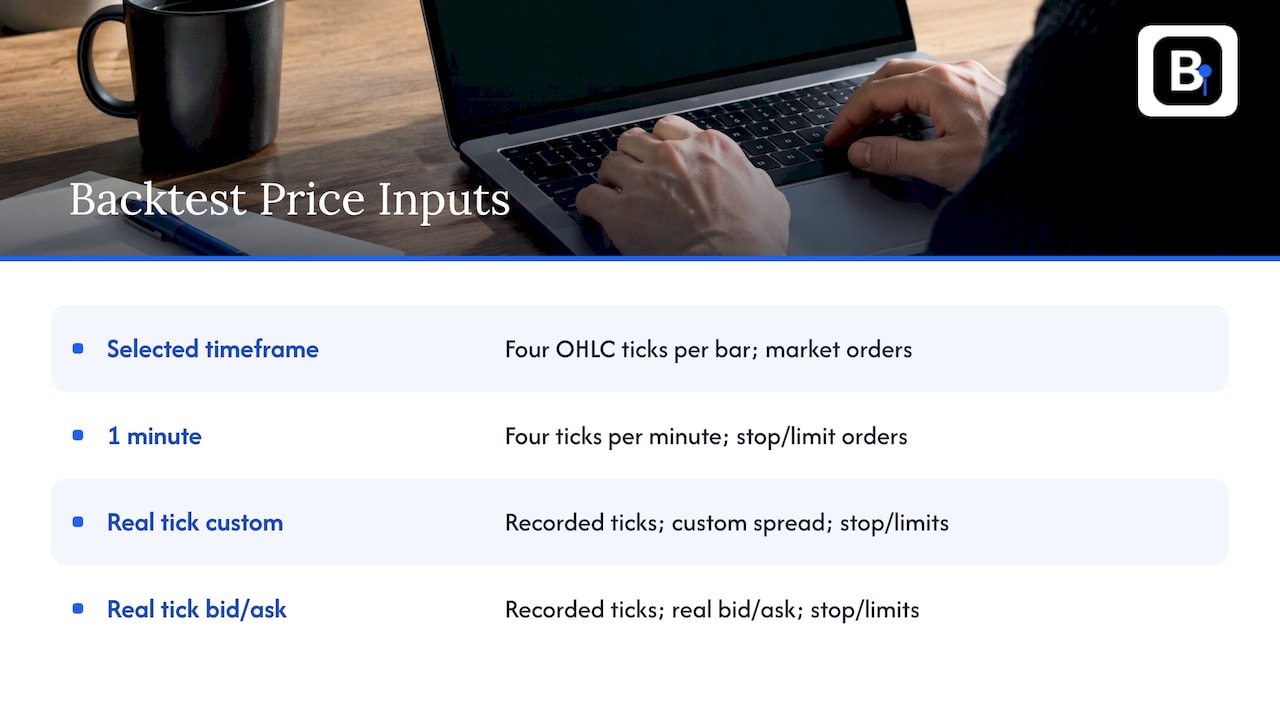
The reason is simple. A one-hour bar tells you the high and the low, but not which came first. If your stop and your target both sit inside that bar's range, the engine has to guess the order. A 60-bar minute series shrinks that guess to a single minute.
Precision also means decimal precision
There is a quieter version of the problem: rounding. A Freqtrade pull request on price precision describes calculating historic precision from the data itself, so that older prices are no longer rounded to today's precision. The authors note this changes backtest results over long periods but makes them more correct. If an instrument's tick size changed over the years, a test that applies today's rounding to old prices distorts small-target strategies.
Why fill logic matters as much as data
Platforms also differ in how they fill protective orders. StrategyQuant's note on reliable JForex backtesting explains that in JForex a stop loss or take profit fills at the price of the tick that triggered it, while in MetaTrader it fills at the set level. Its conclusion is that real tick precision is needed for reliable JForex results. The lesson applies broadly: know your engine's fill rule before you trust a number it produces.
Choosing the right precision level for your strategy
Match the resolution to what the strategy depends on.
| Strategy type | Order types | Reasonable starting point |
|---|---|---|
| Daily or hourly swing, market orders at bar close | Market | Bar-only mode on clean bars |
| Intraday with stops and targets inside bars | Stop, limit | 1-minute data or tick simulation |
| Scalping, tight targets, spread-sensitive | Stop, limit | Real tick data with real spread |
More precision is not automatically better. EdgeVeris Journal makes the point that data granularity is not execution certainty: a one-second chart does not prove the fill engine used it, and recalculating a one-minute indicator on one-second bars changes the strategy itself. Choose the finest data your engine will genuinely use, and keep the signal timeframe consistent.
For a deeper look at the trade-offs, see our comparison of tick versus minute data, and our test for when 1-minute and 5-minute bars mislead.
Check the data before you tune anything
A precise engine fed bad prices produces precise nonsense. Validation comes before indicator tuning, and a profitable-looking report can hinge on a repeated candle, a missing close or a silent timezone conversion, as this data validation guide puts it.
A practical intake checklist
- Timestamps. Strictly increasing, no duplicates. QuantProp's methodology also says never to silently sort or delete a row; record any transformation beside the new snapshot.
- Price bounds. Finite, strictly positive, no NaN or null values.
- Bar logic. High at least as large as open and close, low no larger than open and close, high at least low. OpenBacktesting's checklist lists these alongside volume, corporate action and timezone checks.
- Timezone. Normalize to one standard and know what a timestamp means (bar open or bar close).
- Provenance. Record vendor, retrieval date and time zone, row counts, and compare the cleaned series with the raw file on a few dates.
Be realistic about what these rules prove. They catch contradictory candles, but the same guide notes they cannot show that a vendor recorded the right prices: a plausible candle can still belong to the wrong symbol, adjustment series or interval.
Gaps and spreads inside bars
Count intraday gaps, report the longest one, and exclude obvious weekends. Radius Red's cache audit flags gaps over 15 minutes and also summarizes each bar's high-low range, looking for zero or negative ranges and extreme-wide bars. A cluster of wide bars in one date range often means thin reporting then.
Do not forward-fill missing bars
Filling a hole with flat candles feels tidy but is dangerous. OpenBacktesting warns that forward-filling through an unscheduled halt creates synthetic zero-volatility bars, so a naive test assumes liquidity and fills limit orders that could never have traded. The validation guide above advises quarantining, reloading or explicitly modeling the gap, and keeping that choice in the run configuration.
Verify the vendor, too
Sonar Sciences suggests three vendor checks: spot checks against a primary source, a gap census across the full history, and revision tracking when history changes after delivery. If your conclusions move materially between data versions, treat that as a research validity problem, not just an engineering one.
Model costs and fills honestly
Price precision is wasted if every trade fills at a price you could never get. The screamer documentation states that fees, spread and slippage are usually the difference between a strategy that works on paper and one that works live. It recommends running every strategy with and without costs: a large gap means the edge is small relative to trading costs.
The core rules:
- Cross the spread. A buy fills at the ask and a sell at the bid, never at the midpoint, as the Tektii execution docs describe.
- Prefer historical quotes to a fixed spread. The mattheus.ai guide notes that spreads widen and narrow with conditions, and lists five cost components: commissions and fees, spread, market impact, delay and opportunity cost.
- Make timing explicit. Screamer's guidance is to treat a target as decided at a bar's close and execute it at least a bar later; acting on the same bar's earlier prices means using prices already in the past when the signal was known.
With minute bars you can still approximate slippage sensibly. We cover one approach in our minute-bar slippage formula and three estimators in spread modeling for backtests. In forex, also decide whether tick volume is acceptable for your logic, as discussed in tick volume versus real volume.
Stress the result with sensitivity analysis
Once data and costs are right, ask whether the result survives small changes. Adaptrade describes the idea: nudge inputs, prices or the environment slightly. A robust strategy reacts proportionally and modestly, while a fragile one reacts disproportionately or fails.
Practical perturbations:
- Shift parameters to neighboring values and look for a plateau rather than an isolated peak. Pineify notes that a plateau suggests less dependence on one exact input, though neither pattern proves economic validity.
- Raise spread and commission assumptions.
- Change the starting bar and test sub-periods and regimes.
- Compare against a second clean data source.
The SBAI backtesting paper frames the same questions: was the longest available dataset used, were all available markets in the asset class tested, and how sensitive is the model to changes in parameters, markets and history?
For separating design data from evidence, PapersWithBacktest recommends distinguishing in-sample from out-of-sample periods, and warns that random train/test splits can leak information in ordered financial data. Walk-forward testing is the usual time-aware alternative. Our guide to an IS to WFA to OOS workflow in MT5 walks through it.
Where backtests and live trading part ways
Alex Vidovich's paper on backtest-live defects documents six defects in one intraday system: three from data (including prices adjusted for dividends that live orders never see), two from code (including UTC timestamps read as New York time), and one from configuration. The point is that drift can hide in summary statistics. Each defect had a measurable cost.
The screamer documentation lists seven common faults: look-ahead, unrealistic fills, missing costs, fragile timing, luck, selection and backtest-live divergence. Most trace back to precision: the price you assumed versus the price that existed.
Our perspective
We collect and verify minute-bar data ourselves, and the lesson from years of supporting quants is consistent: most disputes about a strategy are really disputes about the data. A backtest cannot be more precise than the bars it reads.
That is why we focus on clean, complete minute-bar history since 2014, delivered in a ready-to-import format for MT4 and MT5. Our approach is designed around bar-by-bar verification and documented adjustments, so you can spend your time on the strategy rather than on repairing files.
Minute bars are a strong middle ground. They give stop and target logic far more resolution than hourly bars, keep files manageable, and let you model spread and slippage explicitly. Our engineers answer data questions directly, because a gap or a timezone doubt should never stall your research.
Start
Start with clean data
If you want a full, import-ready history without cleaning files yourself, browse our historical data sets covering forex, metals, bonds and stock indices. The Annual Plan is 119 EUR per year.

If you are still comparing sources, our overview of forex minute data sources for MT4 and MT5 explains what to look for.
FAQ
Is tick data always needed for an accurate backtest?
No. Bar-only simulation is usually sufficient for market orders, while stop and limit orders benefit from tick simulation, according to StrategyQuant's documentation. Minute data is a practical middle path for many intraday systems.
How do I know my historical data is clean?
Run intake checks: ordered unique timestamps, finite positive prices, consistent OHLC ranges and a gap count. Then compare a handful of dates against the raw file or a second source. These checks catch contradictions, not wrong-symbol errors, so spot checks matter.
Should I fill missing minute bars?
Not automatically. Flat synthetic candles create false indicator history and fills that could not have happened. Quarantine, reload or explicitly model the gap, and record the choice.
Why does my backtest look better than live trading?
The usual causes are missing costs, fills at unavailable prices, look-ahead and data differences between test and live feeds. Run with and without costs and compare the two.
Sources
- StrategyQuant: Settings – Data
- Freqtrade pull request 11711
- StrategyQuant: Reliable backtesting in JForex
- EdgeVeris Journal: Data feeds and execution models
- Backtest Data Validation: Timestamps, Gaps and Warmup
- QuantProp: Trading Data Quality and Dataset Provenance
- OpenBacktesting: Backtesting Data Checklist
- Radius Red: Auditing a Data Cache
- Sonar Sciences: How to verify a data vendor's history
- Screamer: Backtesting best practices
- Tektii Docs: Backtest Execution and Costs
- mattheus.ai: How to Model Trading Costs in a Backtest
- Adaptrade: Stress Testing for Trading Strategy Robustness
- Pineify: Backtest Sensitivity Analysis
- SBAI: Backtesting
- PapersWithBacktest: How We Verify Track Records
- Alex Vidovich: Where Backtests and Live Trading Part Ways
Recommended
- 99% Modeling Quality for Quants: MQL4 Data Prep Per Year Gap Audit
- Prevent Flipped Backtests: Index Data Accuracy QA for Nifty 50 1m
- How to Achieve 99% Modeling Quality in MT4 for Backtests
- Quants: Run This 7 Step Data Audit Before Backtesting on MT4/MT5
Related resources
Explore BacktestMarket's historical data packs to put the ideas in this article into practice.