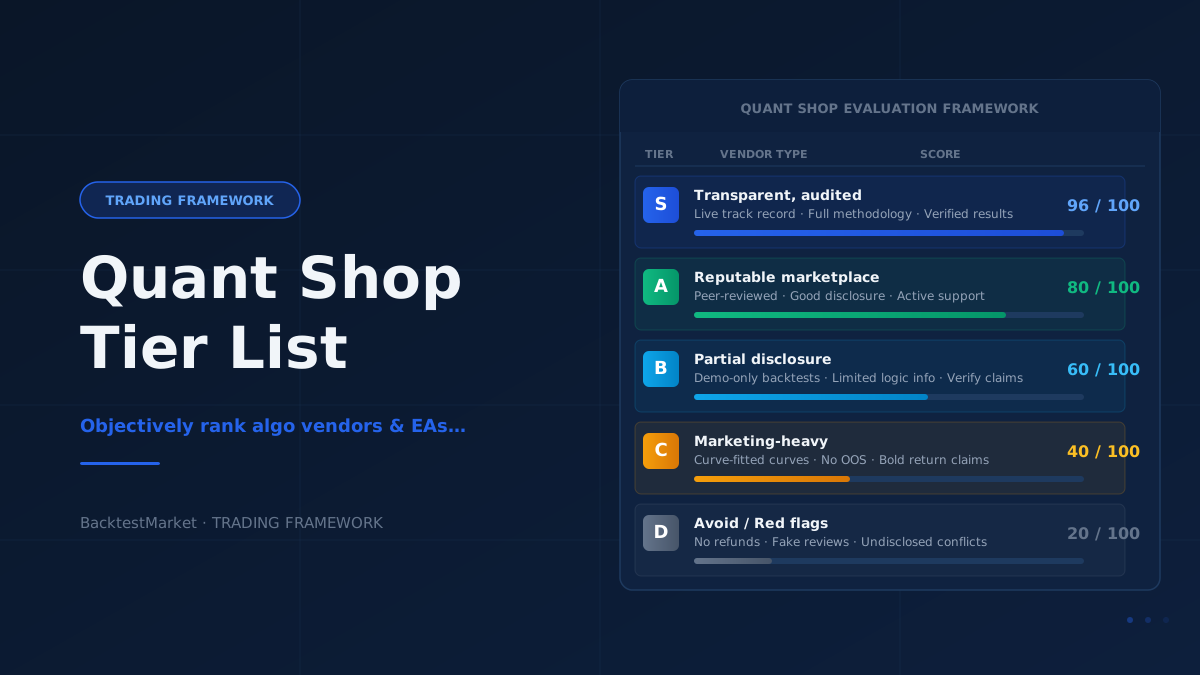
If you've spent any time in retail algorithmic trading forums lately, you've probably seen the debate: which quant shops, EA vendors, and strategy marketplaces are actually worth your time? The discussion has been picking up steam, and for good reason — the barrier to publishing a strategy is now essentially zero, while the barrier to publishing a credible one remains high. The result is a crowded market where separating signal from noise has become a skill in itself.
This article isn't a ranked list of named vendors. Instead, it's a practical framework for building your own tier list — the criteria that should determine where any quant shop, EA developer, or strategy marketplace lands in your personal ranking. Apply this to any vendor you're evaluating, including products here on BacktestMarket.
Tier S: What Genuine Transparency Looks Like
The top tier belongs to vendors who treat transparency as a non-negotiable standard, not a marketing afterthought. Here's what that looks like in practice.
Full backtest methodology disclosure. A credible vendor should tell you which platform the backtest was run on (MT4, MT5, NinjaTrader, etc.), the data source and its tick quality, the spread and commission assumptions, and whether slippage was modeled. If any of these are missing, you're not looking at a backtest — you're looking at a chart.
Out-of-sample results. In-sample optimization is easy; anyone can curve-fit a strategy to historical data and produce an equity curve that looks compelling. What separates Tier S vendors is evidence of out-of-sample testing — a clearly defined period of data that was held back from the optimization process and used only for validation. Walk-forward analysis results, if provided, are an even stronger signal.
Realistic trade assumptions. Spreads widen during news events and at session opens. Tier S vendors model this. They also account for commission structures that reflect actual broker conditions rather than an idealized zero-cost environment. Look for backtest reports that specify the exact spread or commission value used, not just "variable spread assumed."
Monte Carlo or robustness analysis. Professional quant shops run thousands of randomized simulations on their equity curves to stress-test performance under varied conditions. If a vendor provides Monte Carlo results — showing the range of possible drawdown outcomes, not just the best case — that's a strong credibility signal.
Live or forward-test evidence. Backtests are hypotheses. Forward tests are experiments. The best vendors provide verified live account statements or myfxbook-style tracking that covers a meaningful duration (typically 6–12 months minimum for a system trading daily or 4-hour bars). Short forward-test windows are nearly useless for statistical inference.
Tiers A and B: The Credible Middle Ground
Most legitimate quant shops and EA developers fall into these two tiers. They're not cutting corners in bad faith, but they may lack resources or experience to meet the full S-tier standard. Understanding what distinguishes A from B helps you make informed trade-offs.
Tier A characteristics:
- Backtests are provided in a standardized format (MT4/MT5 Strategy Tester report or equivalent) with clearly stated parameters
- Data quality is disclosed — ideally using high-quality tick data rather than broker-provided OHLC data with synthetic ticks
- At least basic walk-forward or out-of-sample results exist, even if Monte Carlo is absent
- Risk metrics are reported: maximum drawdown (both absolute and percentage), Sharpe ratio or profit factor, and average trade duration
- The vendor responds to technical questions and can explain the strategy logic at a conceptual level without revealing proprietary source code
Tier B characteristics:
- Backtest reports are provided but methodology documentation is thin
- In-sample optimization is evident (suspiciously smooth equity curves with very low drawdown are a red flag here)
- No live forward-test results, but the vendor is honest about this limitation
- Strategy logic is described in general terms but lacks enough specificity to evaluate edge independently
The practical difference between A and B often comes down to data quality. A strategy backtested on MT4's default 1-minute OHLC data with "every tick based on real ticks" modeling is meaningfully inferior to one tested on independently sourced, high-quality tick data. If you want to replicate or extend a backtest using proper tick data, the historical data packs available at BacktestMarket provide a solid foundation for running your own validation.
Tiers C and D: The Warning Signs
This is where things get risky — not necessarily fraudulent, but risky in ways that are predictable once you know what to look for.
Tier C: These vendors may have genuine trading knowledge but present it poorly or incompletely.
- Equity curves are shown as images rather than raw backtest reports, making independent verification impossible
- Drawdown figures are suspiciously low or not disclosed at all
- Strategy descriptions lean heavily on technical indicator names without explaining the underlying logic or edge
- "Live results" consist of a few weeks of trading, which is statistically insufficient to distinguish skill from luck
- Spread and slippage assumptions are either absent from documentation or set unrealistically low (e.g., 0 pips spread on EURUSD)
One particularly common Tier C pattern: optimized parameters that work brilliantly on the exact historical window shown but haven't been tested on any other period or instrument. This is the classic in-sample overfitting problem. An equity curve with 50+ parameters optimized on two years of data tells you almost nothing about future performance.
Tier D: These are the vendors to avoid outright, regardless of how impressive the marketing looks.
- No backtest report provided — only screenshots of a terminal showing a winning trade or two
- Guaranteed profit claims, fixed monthly return promises, or language that implies past backtested results are predictive of future live results
- "Proprietary" results that cannot be independently verified in any form
- Extreme parameter sensitivity: the strategy's performance collapses with even small changes to the input values
- No response to basic technical questions about methodology
A reliable heuristic: if a vendor's pitch would sound at home in a late-night infomercial, it belongs in Tier D.
How to Build Your Own Evaluation Process
Applying this framework consistently takes some upfront investment, but it pays off quickly. Here's a practical checklist for evaluating any algorithmic trading product before purchasing:
Step 1 — Request the full backtest report. For MT4/MT5 products, this means the XML or HTML Strategy Tester report, not a screenshot. Check that it includes the full list of trades, not just the summary statistics.
Step 2 — Verify data quality. Ask the vendor what data source was used. Independent tick data from a reputable provider will typically outperform broker-fed synthetic tick data in terms of modeling accuracy. If you plan to run your own validation, ensure your data source matches the original test conditions as closely as possible.
Step 3 — Check the parameter sensitivity. Run the strategy yourself with inputs varied by ±10–20% from the optimized values. If performance degrades catastrophically with small changes, the strategy is overfit. Robust strategies tend to show gradual, graceful degradation across a reasonable parameter range.
Step 4 — Examine the drawdown profile, not just the returns. A strategy with a 40% maximum drawdown might be perfectly viable for one trader's risk tolerance and completely unacceptable for another's. The number itself matters less than whether it's disclosed honestly and contextualized against the expected return.
Step 5 — Look for live evidence. Even a short but independently verified live forward test (via myfxbook, FX Blue, or similar) is more informative than an extended backtest because it eliminates data snooping bias entirely.
If you decide to purchase an Expert Advisor robot after completing this evaluation process, you're in a much stronger position than most retail traders — who typically buy based on equity curve aesthetics alone.
Practical Takeaway
The quant shop tier list debate is ultimately a conversation about standards — and the retail algorithmic trading space has historically lacked them. As a buyer, your best defense is a structured evaluation process that focuses on methodology, data quality, and verifiable evidence rather than marketing claims.
The framework above won't guarantee you find winning strategies (nothing will), but it will reliably filter out the strategies most likely to disappoint: those built on overfitting, poor data, or incomplete disclosure.
Before committing capital to any EA or algorithmic strategy, ask yourself: can I independently verify the backtest? Do I understand the assumptions? Is there any out-of-sample or live evidence? If the answer to all three is yes, you're evaluating the strategy on its merits. That's where good decision-making starts.