

Slippage is the gap between the price your strategy expects and the price it actually gets filled at. Minute bars are safe for systems with wide stops that never exit on the same candle they entered; they are unsafe the moment your logic depends on what happened inside that 60-second window. The fix is a one-line correction: adjust every simulated fill by a directional slippage in basis points, applied against the mid or quote price rather than the bar's close, without specifying exact values.
TL;DR:
- Slippage modeling must account for half-spread, temporary impact, permanent impact, latency, jitter, and partial fills, which are not visible in minute bars.
- Impact costs scale with order size relative to average daily volume, requiring different models such as half-spread, square-root permanent impact, or temporary impact based on trade size.
- Implement slippage correction with a simple formula applying impact in basis points, adjusting the mid price directionally for buys and sells, and consider partial fills for large orders.
- For strategies that rely on intrabar timing, minute bars can misprice fills if entry and exit occur within the same bar, making tick-level data necessary for accuracy.
- Ensure your minute data is clean and accurate before applying models; silent gaps, incorrect timestamps, or daylight savings shifts undermine the reliability of slippage estimates.
Table of Contents
- Why Minute-Bar Data Distorts Slippage Modeling
- Practical Slippage And Market-Impact Models For Backtests
- How Do You Implement Slippage In A Minute-Bar Backtest?
- Sensitivity Tests That Reveal a Fragile Backtest
- When Are Minute Bars Enough, and When Do You Need Ticks?
- How Clean Minute-Bar Data Closes the Backtest-to-Live Gap
- Get Clean Data Before You Trust Your Slippage Model
- The Part of Slippage Modeling Everyone Skips
- Sources
Why Minute-Bar Data Distorts Slippage Modeling
A single 1-minute OHLC bar collapses everything that happened during 60 real seconds into four numbers. Real fills are shaped by forces that never show up in open, high, low, and close:
- Half-spread — the baseline cost of crossing the bid/ask, present on every single trade.
- Temporary impact — the price concession needed to get filled quickly, which fades once you stop trading.
- Permanent impact — the lasting price shift your own order leaves behind.
- Latency and jitter — the delay between signal generation and order arrival, often 50 to 300 milliseconds even on a good connection.
- Partial fills — when the book can't absorb your full size at one price.
The deeper problem is intrabar path ambiguity. If your stop and your target both sit inside the same minute's high/low range, a backtest engine has to guess which one got touched first. Empirical comparisons between real tick data and 1-minute OHTC reconstructions show this guess flips outcomes entirely for some expert advisors, turning a profitable system into a losing one purely because of how the OHLC model reorders intrabar events. A scalper holding a trade for 20 seconds lives inside that ambiguity every single trade. A swing system with a 200 pip ATR stop almost never does.
Practical Slippage And Market-Impact Models For Backtests
You don't need an institutional execution desk to model this reasonably well. Three tiers cover most retail and mid-size quant use cases:
- Half-spread only works fine for low-frequency, small-size strategies where your order is a rounding error next to daily volume.
- Square-root permanent impact becomes necessary once your order size is a meaningful fraction of average daily volume (ADV).
- Temporary impact matters when you need speed and are willing to pay for it, since the term scales with your execution rate, not just your size.
Execution research from models like Almgren-Chriss and Gatheral converges on permanent impact scaling roughly with the square root of participation, expressed as impact ≈ η * σ_daily * sqrt(order_size / ADV), plus a separate temporary term tied to how fast you trade rather than how much you trade. That framework gives you a tractable correction for backtests instead of an unbounded guess.
The one-line fill correction most quants actually need: fill_price = mid * (1 + side * slippage_bps / 10,000), where side is +1 for buys and −1 for sells, and slippage_bps is computed per trade from your impact model. For a forex pair trading at 4 pips average spread, that might resolve to 1 to 2 bps at typical size. For a thin index future during the open, it can run 5 to 10 times higher.
These models break down around news releases, opening and closing auctions, and any instrument where ADV is thin enough that your own order moves the tape. Treat those windows as special cases, not edge cases you can average away.
How Do You Implement Slippage In A Minute-Bar Backtest?
You need a handful of inputs per bar: mid price, quoted spread in basis points, trade side, order size, average daily volume, daily volatility, and an assumed short delay between signal and fill.
- Compute a baseline slippage in bps from half-spread plus your impact model's permanent and temporary terms.
- Apply it directionally: buys get pushed up, sells get pushed down, using the fill formula above.
- Add a simulated order delay of a short time and re-sample the reference price if your data resolution allows it.
- For orders larger than roughly 5% of one minute's typical volume, split the fill into two or three partial fills at slightly worsening prices instead of one clean execution.
- Log every realized slippage value per trade rather than just the aggregate, since the distribution tells you more than the average ever will.
The trade-off is speed versus realism. A full tick-level simulation across years of data can take hours; a minute-bar run with a good impact model takes minutes and gets you 80% of the way there for most strategies that don't rely on intrabar timing.
Pro Tip: Run your slippage model twice, once assuming your fills land at the best price in the bar and once at the worst. If your strategy's edge survives both, minute bars are probably fine for it. If the edge disappears under the worst-case pass, you have a tick-data problem, not a strategy problem.
Sensitivity Tests That Reveal a Fragile Backtest
A backtest that only reports one number under one slippage assumption tells you almost nothing. Run this battery before trusting any result:
- Slippage sweep: rerun the full backtest at 0, 0.5, 0.75, and 1.0 ticks (or the bps equivalent) and plot net profit against each.
- Latency sweep: add 100, 200, and 300 milliseconds of simulated delay and watch for cliff-edge drops in performance.
- Volume-adjusted scaling: increase order size relative to ADV and confirm impact costs rise accordingly, then compare against a tick-level reference sample where you have one available.
- Tail tracking: monitor profit factor and the frequency of outsized losses, not just average net profit, since exit slippage tends to run heavier than entry slippage on stop-market fills.
- Abort threshold: define in advance how much edge decay under realistic slippage kills the strategy, so you're not rationalizing a number after the fact.
Store the full per-trade realized-slippage distribution, not just summary statistics. A strategy that survives on average but blows up in the tail 3% of the time is not a strategy you want live.
When Are Minute Bars Enough, and When Do You Need Ticks?
The rule of thumb is straightforward: if your entry and exit can occur within the same minute, or your stop and target both sit inside a single bar's high/low range, minute bars may misprice your fills and tick data is preferable.
- Systems with multi-hour or multi-day holding periods and stops well outside typical 1-minute ranges generally work fine on minute bars.
- Scalping, mean-reversion systems with tight targets, and trades around news or session opens/closes benefit from tick-level fidelity to avoid modeling noise as edge.
- Liquidity matters: instruments where your order size approaches a notable share of one minute's volume should apply volume-adjusted models.
- If tick data is not available, consider randomizing the intrabar sequence in simulations to estimate uncertainty rather than relying on a single OHLC path.
How Clean Minute-Bar Data Closes the Backtest-to-Live Gap
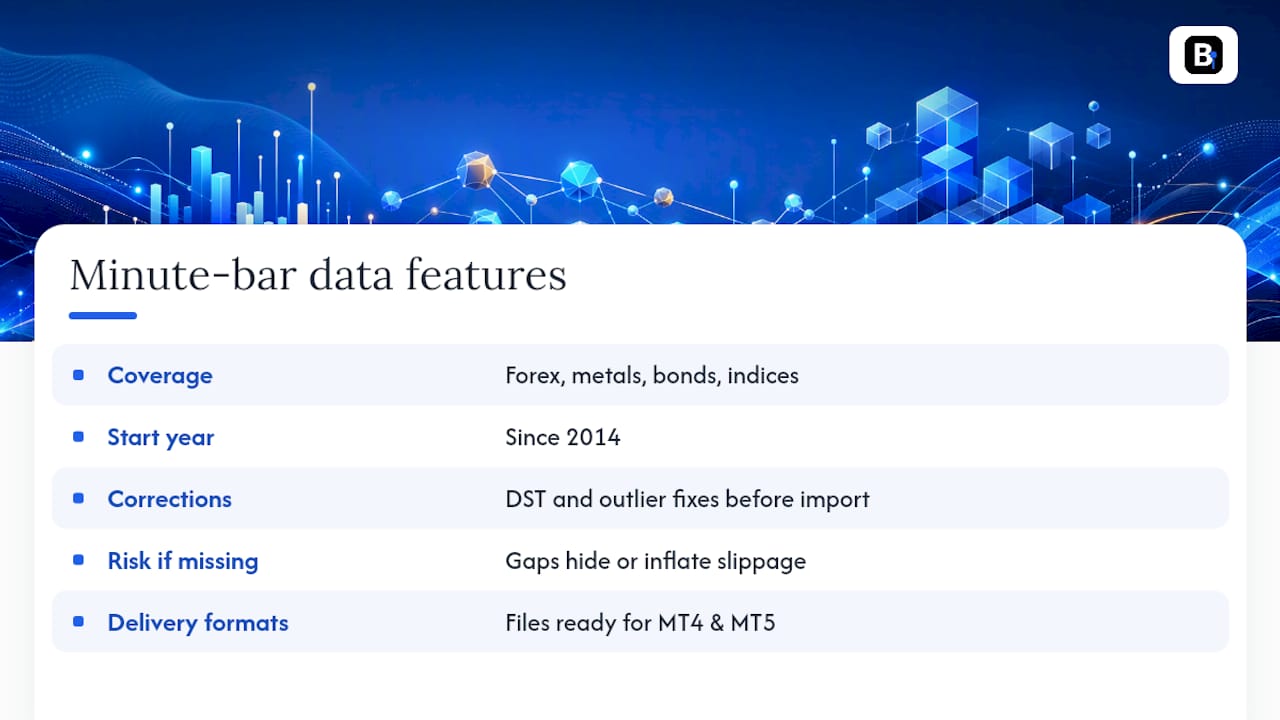
Slippage models only help if the underlying bars are accurate. Backtestmarket has supplied clean, minute-bar historical data across forex, metals, bonds, and indices since 2014, with daylight-saving and outlier corrections applied before you ever import a file. Missing bars and misaligned timestamps quietly inflate or hide slippage in a backtest, since a gap can make an impact model attribute a price jump to liquidity instead of a data error. Datasets arrive ready for MT4 and MT5, and Backtestmarket's guide on daylight saving time fixes walks through exactly which timestamp errors to check for first.
Get Clean Data Before You Trust Your Slippage Model
Every formula in this article assumes your input bars are accurate. If your minute data has silent gaps or DST shifts, no impact model will save the backtest. Backtestmarket's historical intraday datasets come pre-cleaned and ready to import, and the MetaTrader import guide walks through setup in MT4 and MT5. Traders running NinjaTrader can follow the equivalent NinjaTrader import guide, and forex-focused strategies can start directly from the forex dataset page.
The Part of Slippage Modeling Everyone Skips
Most articles on this topic stop at citing Almgren-Chriss and calling it a day. That's theory, not a backtest you can run tonight. The gap between knowing the square-root law exists and actually coding fill_price = mid * (1 + side * slippage_bps / 10,000) into your simulation loop is where most retail quant strategies quietly die in live trading.
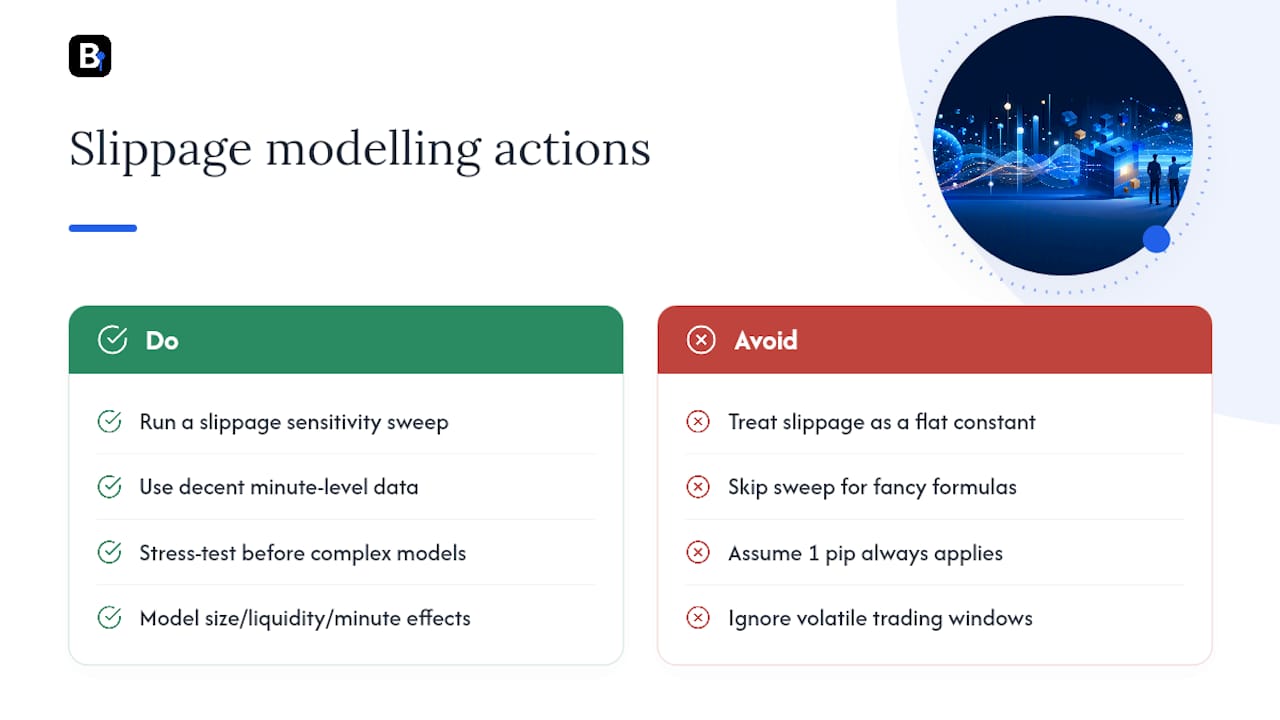
The conventional advice, "just add a few pips of slippage," treats slippage as a constant when it's actually a function of your order size, the instrument's liquidity, and the specific minute you're trading in. A flat 1 pip assumption on EUR/USD at 2 AM behaves nothing like the same assumption during the New York open.
If you take one thing from this, prioritize the sensitivity sweep before you touch a fancier impact model. A strategy that survives a slippage and latency sweep on decent minute data is more trustworthy than one built on a beautifully derived impact formula nobody stress-tested. Get the data right, run the sweep, and only then worry about whether you need ticks at all. For traders looking to manage risk around volatile windows more broadly, the approach to avoiding forced selling during volatility offers a useful parallel: the goal is never zero risk, it's knowing exactly where your model stops being trustworthy.
— Start
Sources
For the underlying math, read the execution research behind the square-root impact model and the empirical tick-versus-OHLC comparison. For a broader view of what drives slippage day to day, including timing risk around news windows, see the guide to trade slippage and its definition on Investopedia.
- Execution Simulation: Slippage and Market Impact
- Backtest to Live: Closing the Performance Gap in Automated Futures Trading - NexusFi Academy
Recommended
- Minute Bar Data: What Quants Need for Reliable Backtests
- Holiday Gaps in Market Data: A Quant's Handling Guide
- How to Achieve 99% Modeling Quality in MT4 for Backtests
- 5 Audits Quants Must Run on Outlier Handled M1 Data Before MT4/MT5
Related resources
Explore BacktestMarket's Expert Advisor robots to put the ideas in this article into practice.