
The "Sell in May and Go Away" Pattern
One of the oldest stock market adages says: "Sell in May and go away, and come back on St. Leger's Day" (the third Saturday in September). The idea is that equity returns cluster in the winter months — October through April — and that the summer period from May through September is consistently weaker.
This is not folklore. It is a documented, persistent anomaly across major equity indices, particularly the S&P 500. The question for systematic traders is whether it is exploitable after transaction costs — and whether it can be encoded into a repeatable trading strategy.
The Seasonal Pattern in the S&P 500
Looking at long-term S&P 500 data, the pattern is clear:
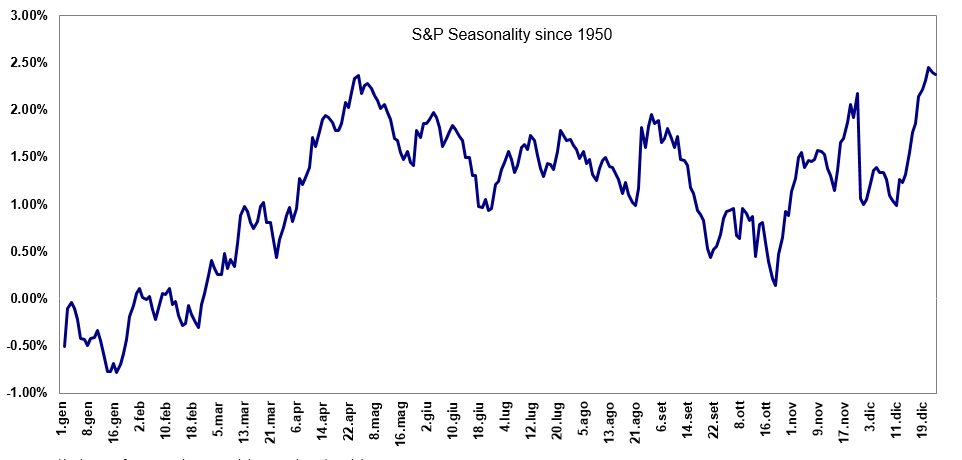
The data shows:
- October to April is historically the stronger half of the year for US stocks
- May to September is historically flat or negative on average
This is not a one-year observation. It has persisted across multiple decades, different market regimes, and different rate environments.
October–April vs May–September Performance
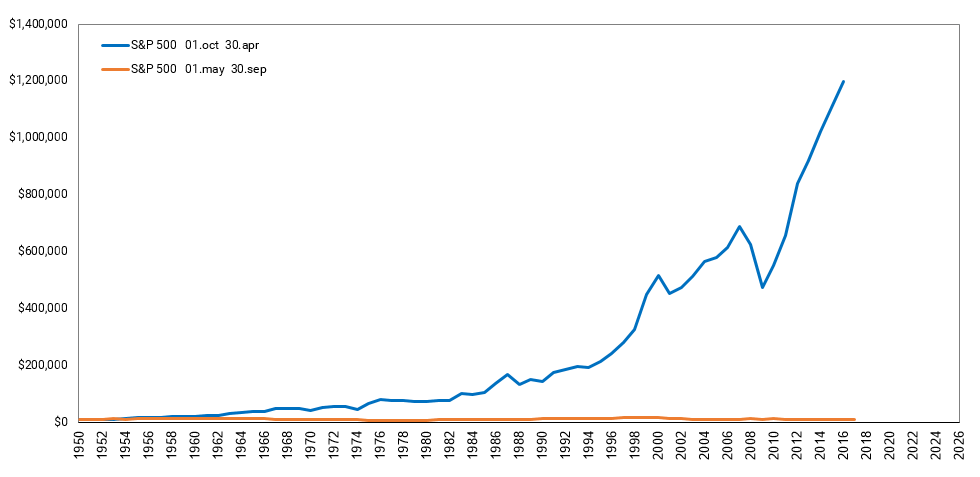
Splitting the S&P 500 calendar into two halves and comparing cumulative performance over time:
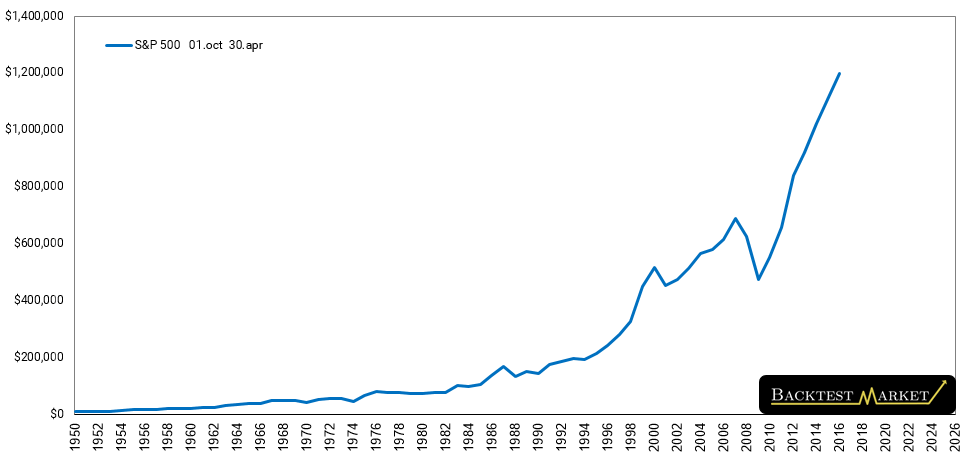
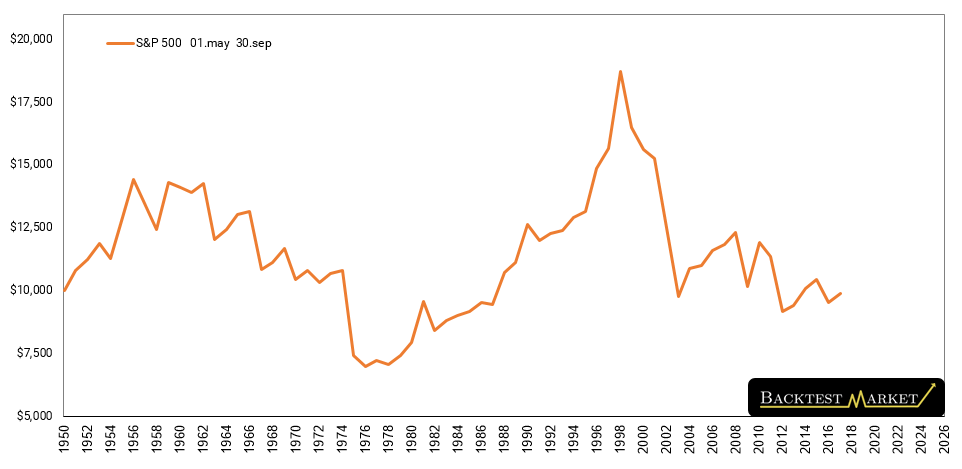
The divergence between the two halves is striking. The winter season (Oct–Apr) accounts for the overwhelming majority of long-term equity gains. A strategy that was only invested in stocks from November through April, for example, would have captured most of the S&P 500's historical returns with far less time in the market.
Building an Expert Advisor Around Seasonality
The next step is to turn this calendar observation into a systematic rule. A basic approach:
- Enter long around the beginning of October (when the strong season begins)
- Exit long at the end of April or the beginning of May (when the weak season begins)
- Remain flat or short from May through September
Looking at specific entry timing within October, early October days have historically been particularly strong:
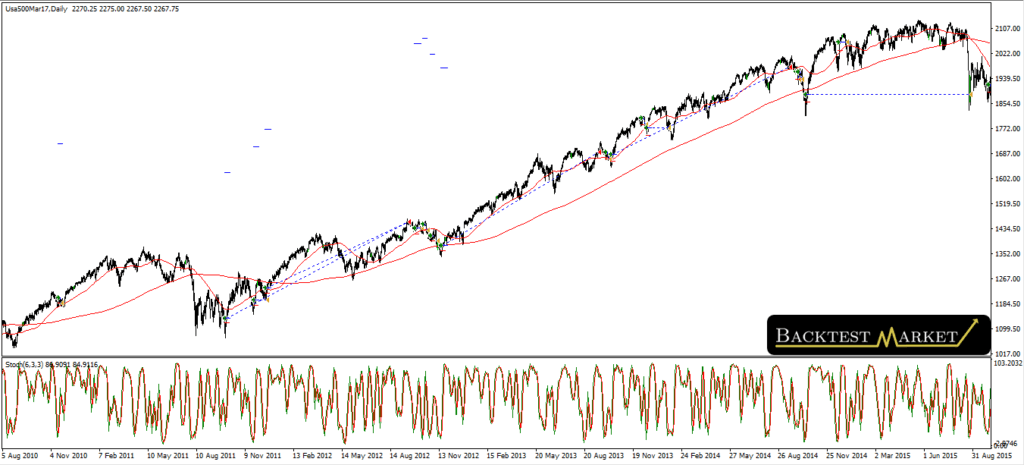
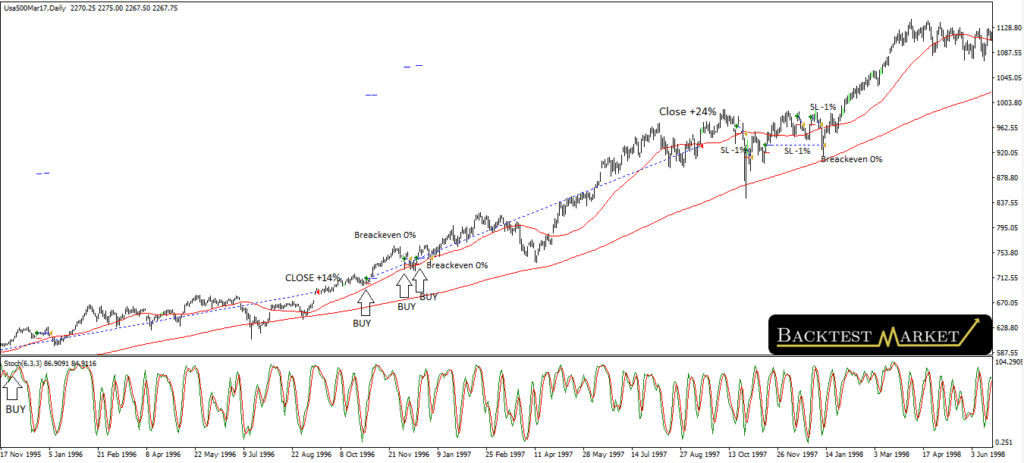
The precise entry date within October matters less than being invested during the October-to-April window, but fine-tuning can improve the risk-adjusted return.
The Accumulator Portfolio Approach
Seasonal strategies work best when combined with multiple instruments. A single-market seasonal system is exposed to idiosyncratic events (recessions, geopolitical shocks) that can break the pattern in any given year. The accumulator portfolio approach runs seasonal logic across a basket of non-correlated instruments:
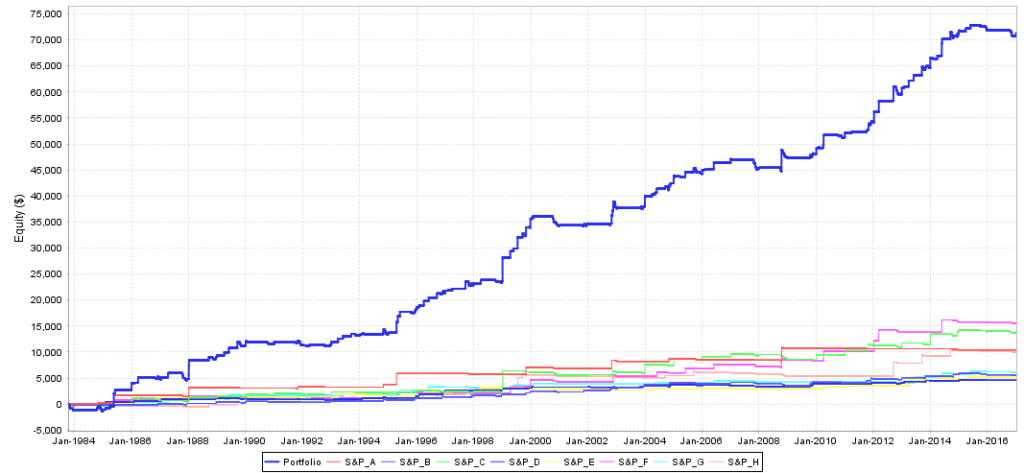
By diversifying across instruments that each exhibit seasonal tendencies — US stocks, European stocks, commodities, bonds — the portfolio smooths out the year-to-year variance in any single market's seasonal behaviour.
Performance Comparison
Comparing the seasonal strategy against a passive buy-and-hold benchmark across different market conditions:
The seasonal approach does not always outperform buy-and-hold on absolute returns in bull markets. Its advantage is in risk-adjusted returns: it avoids the worst drawdowns (which historically cluster in the May–September period) while capturing the majority of the upside.
Key Takeaways
- The S&P 500 seasonal pattern (Oct–Apr strong / May–Sep weak) is a well-documented, multi-decade anomaly
- It can be encoded into a systematic Expert Advisor with straightforward entry and exit logic
- The strategy's primary advantage is drawdown reduction, not necessarily higher absolute returns
- Combining seasonal rules across a portfolio of instruments (accumulators) significantly improves consistency
- No strategy works every year — the pattern fails in years with strong summer rallies, which is why position sizing and risk management remain essential
For historical data to backtest this type of strategy, see our products catalog.