

Volume aggregation is the way individual trades or quote updates are counted and summed into bars (1-minute, 5-minute, daily). Three choices decide whether the result is trustworthy: what you count (traded size or tick count), how you sum it (integer-preserving, with consistent bar boundaries), and which feed and filters sit underneath. This guide walks through each choice, explains why intraday bars rarely add up to the published daily total, and shows how to separate real volume spikes from data errors before you backtest.
TL;DR
- Real volume is traded size (shares or contracts). Tick volume is a count of price updates, so it is an activity proxy and not comparable to exchange volume.
- Sum volume as integers over fixed bar boundaries. Float conversion during resampling can corrupt totals.
- Intraday bars often differ from the daily total because block, spread and other trades may appear in the daily figure but not in 1-minute data.
- Spikes can be real or phantom. Check price geometry, wick size and volume coherence, and inspect flagged bars instead of auto-filling them.
- Document the feed, filters and session coverage behind every volume series you test on.
Table of Contents
- What "volume" means before you aggregate it
- How volume rolls up into bars and longer periods
- Why intraday bars do not add up to the daily total
- Choices that depend on instrument, venue and feed
- Intraday volume anomalies: real activity or bad data?
- A cleaning and validation checklist before you backtest
- Our perspective: volume you can reproduce
- Start from clean minute bars
- FAQ
- Sources
What "volume" means before you aggregate it
Aggregation only makes sense once you know what is being aggregated. Trading volume is the total number of shares or contracts exchanged in a market over a specified period, and it serves as a gauge of activity and liquidity. On a centralized exchange, every executed trade has a size, so a bar's volume is the sum of those sizes.
Spot forex works differently. It is decentralized, so there is no single tape of trades. Platforms such as MT4 and MT5 usually report tick volume instead: the number of price changes inside a bar, used as a proxy for activity, while real volume records actual units crossed on a centralized exchange. Tick volume counts quote updates rather than traded size, so you should not compare it directly with exchange-reported volume.
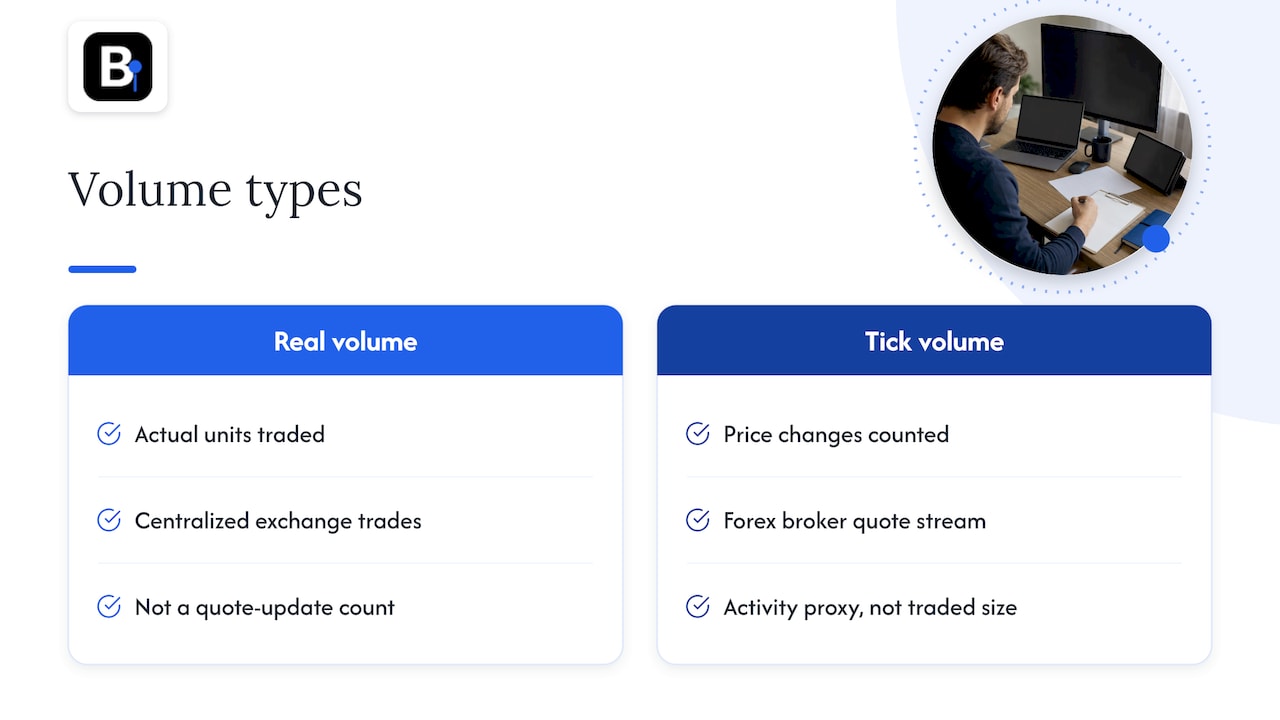
That difference matters in practice. A bar with 400 ticks in forex tells you the quote moved often, not that 400 lots changed hands. If you want the longer treatment for currency pairs, our piece on tick volume versus real volume for forex traders covers when each is the right input. For equities, the same logic shows up in how analysts read unusual volume in U.S. stocks, where the data source and its limitations shape what a spike actually means.
Quick definitions
| Term | What it counts | Typical home |
|---|---|---|
| Real (traded) volume | Shares or contracts executed | Exchange-traded stocks, futures, options |
| Tick volume | Number of price updates in the bar | Spot forex, some CFD feeds |
| Quote volume | Number of quote messages | Depth and quote feeds |
| Notional (dollar) volume | Price times size | Cross-asset comparisons |
The first rule of volume aggregation follows: never mix these in one series. A strategy tuned on tick counts from one broker will not transfer to traded size from an exchange.
How volume rolls up into bars and longer periods
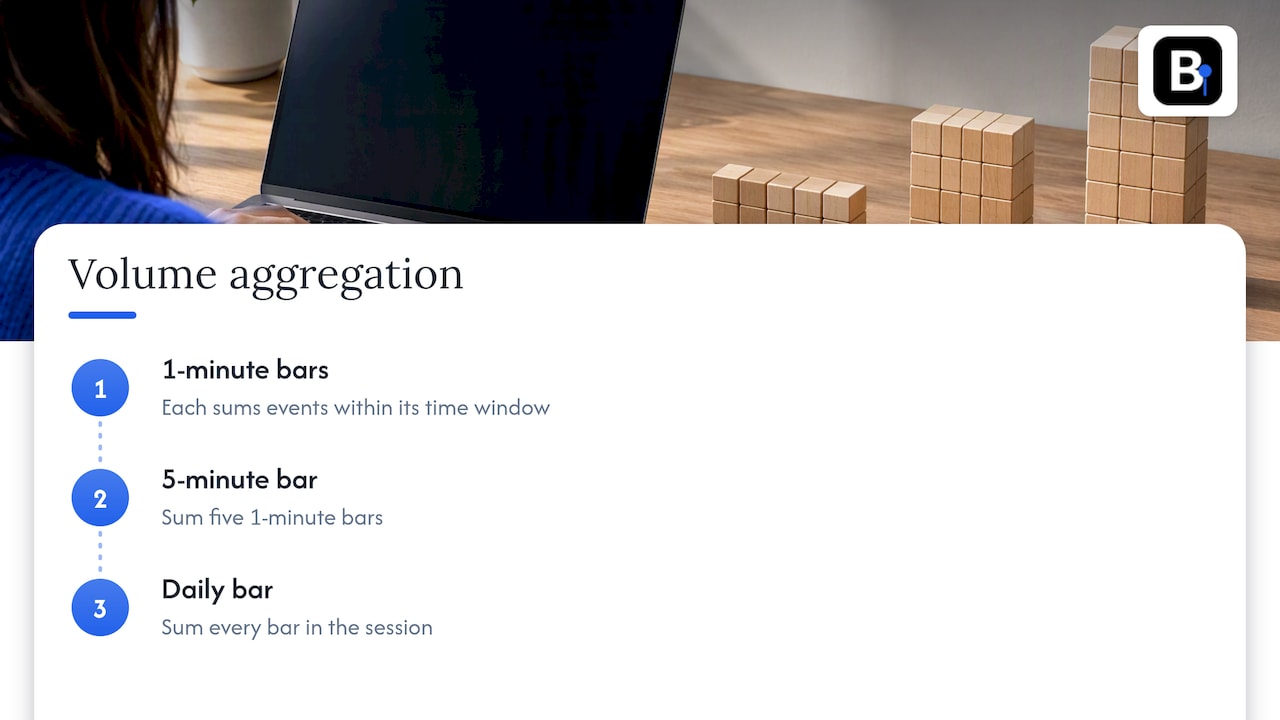
The mechanics are simple. Each bar's volume is the sum of the volume of the events that fall inside its time window. A 5-minute bar is the sum of five 1-minute bars, and a daily bar is the sum of every bar in the session. The trouble is in the details.
Bar boundaries and session coverage
A bar needs a clear rule for which events belong to it. Decide whether the window is open on the left or the right, and which timezone anchors it. A 09:30 to 09:35 bar that includes the 09:35:00 trade will differ from one that does not, and the gap compounds when you resample to hourly or daily. Session coverage is the second boundary: pre-market, regular hours, after-hours and overnight futures sessions each add volume that a regular-hours-only series would omit.
Keep the sums as integers
Resampling code is a quiet source of corrupted volume. One documented case in a Python trading library found that timeframe resampling converted volume to floats and produced high-precision decimal errors, and that integer-preserving sums avoid the problem. The lesson generalizes: when you resample volume, sum it as an integer type, assert that the total before and after resampling matches, and treat any decimal remainder in a share count as a bug.
Aggregation is not always by time
Time bars are the default, but volume is also used to build the bars themselves. Tick bars close after a fixed number of trades, volume bars after a fixed amount of traded size, and dollar bars after a fixed notional amount. Each one samples the market in proportion to activity instead of the clock. We compare six such approaches, with calibration notes for machine-learning backtests, in our guide to bar aggregation methods.
| Method | Bar closes when | Volume's role | Watch out for |
|---|---|---|---|
| Time bars | A fixed interval ends | Summed per interval | Uneven information per bar |
| Tick bars | N trades or ticks occur | Summed, varies by bar | Tick counts depend on feed |
| Volume bars | N units have traded | Constant by design | Needs real volume, not tick proxies |
| Dollar bars | N notional traded | Price-weighted | Needs reliable prices and sizes |
The practical point: volume bars and dollar bars only work with real traded size. Built on tick-count proxies, they measure quote activity, which differs by broker.
Why intraday bars do not add up to the daily total
A common complaint from traders: add up every 1-minute volume bar for a day and the sum does not match the daily bar. This is usually not a bug in your code.
One market-data vendor explains that the exchange's cumulative daily volume may include block, spread and market trades that are not represented in tick or 1-minute intraday data. So the daily figure and the intraday figure can legitimately describe slightly different populations of trades.
Other causes to rule out before you blame the data:
- Different feeds for different intervals. Some charting products source intraday and daily bars from different venues or consolidations.
- Session mismatch. Daily totals may include extended hours while your intraday series covers only regular hours, or the reverse.
- Late-reported trades. Trades reported after the minute they occurred may land in a later bar or only in the end-of-day total.
- Timezone and boundary errors. A one-hour shift around a daylight saving change puts volume in the wrong day.
A useful habit is to compute the ratio of summed intraday volume to the daily volume, per instrument, per day. A stable ratio (say, consistently a bit below 1) points to structural differences like blocks. A ratio that jumps on specific days points to missing intervals or a feed outage.
Choices that depend on instrument, venue and feed
There is no single correct way to calculate volume across asset classes. A practical guide to market-data feeds lists the choices that change the result: feed type, trade-condition filters, bar boundaries, session coverage, and volume units, with shares typical for equities and contracts for options and futures.
Here is how that plays out:
- Equities. Volume is shares, but whether your figure covers one exchange or the consolidated market changes it a great deal. Filters for odd-lot, out-of-sequence or derivatively priced trades change it again.
- Futures. Volume is contracts, split across contract months. Continuous series need a rule for when to roll, and back-adjusting prices does not adjust volume, so decide separately how to handle volume at the roll.
- Spot forex and CFDs. Volume is usually tick volume from a single broker's feed. It reflects that broker's quote stream.
- Indices. An index is a calculation, not a traded instrument, so index volume is often an aggregate of constituents or a proxy from a related future. Our article on indices intraday data sourcing explains how to avoid look-ahead bias there.
Write these choices down. If two volume series disagree, the cause is almost always one of these settings, and a short data note saves hours of debugging later. Our guide to intraday data sources practitioners must audit offers a checklist for this.
Intraday volume anomalies: real activity or bad data?
A spike is not automatically an error, and a smooth series is not automatically clean. A practitioner write-up on intraday data problems says anomalies such as phantom spikes are often caused by fragmented data across venues, late-arriving trades, or different filtering rules between providers.
Known upstream failures
Sometimes the source itself breaks. On August 12, 2019, a SIAC systems issue caused gaps in intraday trades, quotes and other messages sent to the Consolidated Tape System, and the accuracy of that day's transaction and quotation data was described as unknown. If your backtest includes a day like that, no cleaning rule recovers the lost information. Flag it and decide whether to exclude it.
Telling genuine spikes from errors
The same practitioner source suggests combining three signals: price geometry, wick size and volume coherence. In plain terms, ask three questions of a suspicious bar:
- Does the price move make sense? A high or low far outside the neighboring bars, with no follow-through, suggests a phantom print.
- Is the wick unusually long? A thin spike that reverses within the bar is more likely a bad tick than a real move.
- Does volume agree? A large price excursion on near-zero volume, or huge volume with no price change, is incoherent.
A bar that fails all three deserves inspection. A bar that fails one may just be a news event. Our three-condition spike test for intraday data cleaning turns this idea into a repeatable rule.
Volume is not evenly spread across the day
A normal intraday volume pattern is not flat. Activity tends to be heavier near the open and the close, so judging a bar against a daily average misleads. Compare each bar with the typical volume for the same time of day. For the baseline, consider medians rather than averages, since a single news candle or liquidity cascade can distort a mean.
A cleaning and validation checklist before you backtest
Practitioner guidance recommends auditing intraday OHLCV for early-close leakage, phantom highs and lows, stale bars, and missing intervals, inspecting flagged bars, and avoiding automatic filling of missing data. Turned into a workflow:
- Fix the definition. Record whether volume is traded size or tick count, and the unit.
- Check the calendar. Compare bar counts per day with the expected session length, including half days and holidays.
- Look for stale bars. Runs of identical prices with zero volume during active hours often mean a feed dropped.
- Test for phantom extremes. Apply the price, wick and volume checks above to every bar that sets a daily high or low.
- Reconcile with the daily total. Track the intraday-to-daily ratio and investigate days where it moves.
- Verify integer sums. After any resample, confirm that total volume is unchanged.
- Log every change. Keep a list of removed or corrected bars so the backtest can be reproduced.
The warning against auto-filling deserves emphasis. Forward-filling a missing volume bar invents activity that never happened, and a strategy that trades on volume will happily react to it.
Our perspective: volume you can reproduce
We collect and maintain minute-bar data across forex, metals, bonds and stock indices going back to 2014, and the most common volume problem we see is not a wrong number. It is an undocumented number. Two traders can both have "1-minute volume" and be testing different things because the feed, session or filters differ.
Our view is simple. Volume is only useful if you can say exactly what it measures. That means verifying data bar by bar, documenting adjustments, and delivering complete datasets that import straight into MT4 and MT5 so your test environment matches your data environment. It also means being straightforward about limits: tick volume in forex is an activity measure, and we would rather you use it knowing that than mistake it for traded size.
The same standard applies whether a human or a machine learning model reads the bars. A model will find any inconsistency in your volume series and learn it as signal. Clean, consistent aggregation is cheaper than debugging a strategy that was fitted to an artifact.
— Start
Start from clean minute bars
If you would rather spend your time on strategy than on reconciling feeds, our historical data sets give you complete, clean minute-bar history since 2014, ready to import into MT4 and MT5. Prefer ongoing access? The Annual Plan is €119 per year. Our engineers answer support questions directly, including questions about how a series was built.
If you trade U.S. equities, the Most Traded Stocks pack is a focused place to start.
FAQ
What is the difference between tick volume and real volume?
Real volume is the number of shares or contracts actually traded. Tick volume is the number of price updates in a bar. In decentralized markets like spot forex, tick volume stands in for activity, but it does not measure traded size and is not comparable to exchange volume.
Why doesn't the sum of my 1-minute volume equal the daily volume?
Usually because the two figures describe different sets of trades. Daily totals may include block, spread or market trades that do not appear in 1-minute data. Different feeds, session coverage and late-reported trades can also contribute, so track the ratio per day to spot real problems.
How do I aggregate volume correctly when resampling bars?
Sum volume over fixed, consistently defined bar boundaries, and keep the result as an integer. After resampling, check that total volume before and after is identical. Decimal remainders in share counts signal a type-conversion bug.
How can I tell whether a volume spike is real?
Compare the price move, the wick size and the volume together. A spike that is coherent across all three, and that appears on other feeds, is likely genuine. A spike with a thin, reversing wick and no confirming activity is a candidate for removal. Inspect flagged bars manually before changing them.
Should I fill in missing volume bars?
Generally no. Filling invents activity that did not occur and can trigger false signals in volume-based strategies. Flag the gap, check whether the source had an outage, and exclude or handle the period explicitly.
Sources
- Investopedia: trading volume definition
- Timeless Charts: price formation, exchanges vs forex
- GitHub: volume corruption during timeframe aggregation
- Linn Software: daily periodicity volumes and intraday
- Swoopr: trades, quotes, bars and depth feeds
- Concretum Group: how to detect and fix problems in intraday market data
- SEC: notice regarding the August 12, 2019 SIAC issue
Recommended
- Six Bar Aggregation Methods Quants Can Calibrate for ML Backtests
- Prevent Broken Backtests: Intraday Data Sources Practitioners Must Audit
- Quants: Intraday Data Cleaning With a Three Condition Spike Test
- Avoid Blind Spots by 3 PM: Engineered Intraday Correlation for Quants
Related resources
Explore BacktestMarket's Expert Advisor robots to put the ideas in this article into practice.