

To calculate VWAP from minute data, compute a typical price for each bar, multiply it by that bar's volume, and divide the running total of those products by the running total of volume. Restart the running totals at each session open. The arithmetic takes a few lines of code. What decides whether the result is trustworthy is the minute data under it: its volume field, its timestamps and its session boundaries. That is also where most backtests go wrong.
TL;DR
- VWAP = cumulative (typical price × volume) ÷ cumulative volume, where typical price is (high + low + close) ÷ 3 for each 1-minute bar.
- The reset rule is part of the definition: session VWAP restarts every session, anchored VWAP restarts at a bar you choose.
- Minute-bar VWAP approximates the trade-level VWAP. Values differ by input data and by chart timeframe, so build and validate it on one fixed dataset.
- Zero, missing or duplicated volume and shifted timestamps distort VWAP more than the choice of price per bar.
- Clean, consistently documented minute bars matter more than the formula. That is why we sell complete, verified datasets.
Table of Contents
- The VWAP formula in plain terms
- A worked example with five 1-minute bars
- Typical price, close or something else?
- Code: VWAP from a minute-bar table
- When VWAP resets, and why it changes everything
- Why minute VWAP is an approximation
- Volume problems that quietly break VWAP
- A validation workflow you can audit
- Limits to build into the backtest
- Our perspective
- From formula to a dataset you can trust
- FAQ
- Sources
The VWAP formula in plain terms
VWAP stands for volume-weighted average price. It is the average price of an instrument over a period, where each price counts in proportion to the volume traded at it. A minute with 5,000 shares traded moves the line more than a minute with 200.
The five steps, as TradingView's VWAP documentation lays them out:
- Compute the typical price of each bar: (high + low + close) ÷ 3.
- Multiply the typical price by the bar's volume.
- Keep a running sum of those products.
- Keep a running sum of volume.
- Divide the first running sum by the second.
In one line: VWAP at minute t = Σ(TP × V) ÷ ΣV, summed from the reset point up to and including minute t. Because both sums are cumulative, the VWAP of the first bar of the day is simply its typical price, and the line gets steadier as the session builds.
A worked example with five 1-minute bars
Take five consecutive bars from one session. Prices are in dollars, and the figures are illustrative, not market data.
| Minute | High | Low | Close | Volume | Typical price | TP × V | Cum. TP × V | Cum. volume | VWAP |
|---|---|---|---|---|---|---|---|---|---|
| 1 | 100.30 | 99.90 | 100.20 | 1,000 | 100.1333 | 100,133.3 | 100,133.3 | 1,000 | 100.13 |
| 2 | 100.50 | 100.10 | 100.40 | 1,500 | 100.3333 | 150,500.0 | 250,633.3 | 2,500 | 100.25 |
| 3 | 100.60 | 100.20 | 100.30 | 800 | 100.3667 | 80,293.3 | 330,926.7 | 3,300 | 100.28 |
| 4 | 100.40 | 99.80 | 99.90 | 2,500 | 100.0333 | 250,083.3 | 581,010.0 | 5,800 | 100.17 |
| 5 | 100.00 | 99.70 | 99.80 | 700 | 99.8333 | 69,883.3 | 650,893.3 | 6,500 | 100.14 |
Two things to notice. First, minute 4 had the most volume and a lower typical price, so it pulled the VWAP down from 100.28 to 100.17 in one step. A simple average of the five typical prices would be about 100.14 here, but it would not have reacted that way to the heavy minute. Second, by minute 5 the VWAP is 100.14 while the last close is 99.80: the line summarizes the whole session so far, not the latest price.
Typical price, close or something else?
There is no single correct price per bar. Open-source engines make different choices:
- QuantConnect's LEAN engine, in its IntradayVwap source, uses each trade's last price and quantity when it receives trade ticks. For a trade bar it uses (high + low + close) ÷ 3 multiplied by the bar's volume.
- The PyAlgoTrade VWAP indicator lets you choose between typical price and close as the bar price.
On the five bars above, using the close instead of the typical price gives a total of 650,650 over 6,500 shares, a VWAP of 100.10 rather than 100.14. A four-cent gap on a $100 instrument is small, but it is systematic, and it can flip a signal that fires when price crosses the line by a cent or two.
The practical rule: pick one definition, write it into your strategy specification, and use it in every test and in live trading. Comparing a typical-price VWAP in research to a close-based VWAP on your execution platform is a classic source of "the backtest does not match live" confusion.
Code: VWAP from a minute-bar table
In pandas, with a DataFrame df indexed by timestamp with high, low, close, volume columns:
df["tp"] = (df["high"] + df["low"] + df["close"]) / 3
df["pv"] = df["tp"] * df["volume"]
df["session"] = df.index.date
g = df.groupby("session")
df["vwap"] = g["pv"].cumsum() / g["volume"].cumsum()
The groupby on the session key is the reset. If your data spans an overnight session, a calendar date is the wrong key, as the next section explains. Where cumulative volume is zero, the division returns NaN. Leave it as NaN rather than filling it with a price, so the strategy knows there is no VWAP yet.
When VWAP resets, and why it changes everything
The line is only meaningful relative to its starting point. Three setups are common:
- Session VWAP. Resets at the start of each trading session. For US equities that usually means the regular session open, though many charting tools let you include pre-market and after-hours bars, which changes the starting volume and the whole line.
- Anchored VWAP. Starts at a bar you pick, such as an earnings gap, a swing low or a futures roll, and runs until you stop it. Sierra Chart's studies documentation notes that a start date-time anchor needs both a date and a time.
- Rolling VWAP. Uses only the last N bars, so it behaves like a volume-weighted moving average and never resets.
For instruments that trade nearly around the clock, such as forex, metals and index futures, "the session" is a choice, not a fact. Decide whether it starts at 00:00 UTC, at the exchange's daily settlement or at the start of a regional session, and keep the choice fixed. Be aware of the timezone your bars are stamped in, because a one-hour offset around daylight-saving changes will put the reset in the wrong place twice a year.
Why minute VWAP is an approximation
A true VWAP is built from every trade: each print has its own price and size. A 1-minute bar compresses all prints in that minute into four prices and a volume. Using the typical price assumes the minute's volume traded at the average of high, low and close, which it rarely did exactly.
Sierra Chart's documentation states that VWAP depends heavily on its input data. For the most accurate values, identical across timeframes, you set the study to use the underlying data that makes up the bars, and tick-by-tick data is recommended. Without that, it uses each bar's last trade price and total volume, and values differ from one chart timeframe to another. The same documentation explains that standard-deviation bands differ across timeframes too, because a 5-minute chart holds only every fifth value that a 1-minute chart does.
This explains a common forum complaint: the same VWAP looks different on a 1-minute and a 5-minute chart. It is not a bug in one of them, it is two different approximations of the same quantity.
What this means for a backtest:
- Build VWAP on the finest bars you have, then resample the result. Do not compute it on 5-minute bars and call it a minute VWAP.
- Expect small differences against a trade-level VWAP, largest in thin minutes and at the open and close.
- Keep the bar interval of research and live trading identical.
Our own write-ups go deeper on the trade-off: tick versus minute data and how volume is aggregated into bars show where minute bars are enough and where they are not.
Volume problems that quietly break VWAP
VWAP is a ratio, so every error in the volume field flows straight into the result. Check these before you trust any line:
Zero volume bars. A zero adds nothing to either sum, which is correct if no trade happened. But a zero that stands for missing data is a different thing: the bar's price moved, yet it was given no weight. Count zero-volume bars per session. A handful in a quiet overnight stretch is normal. A cluster in the middle of the busiest hour points to a data gap.
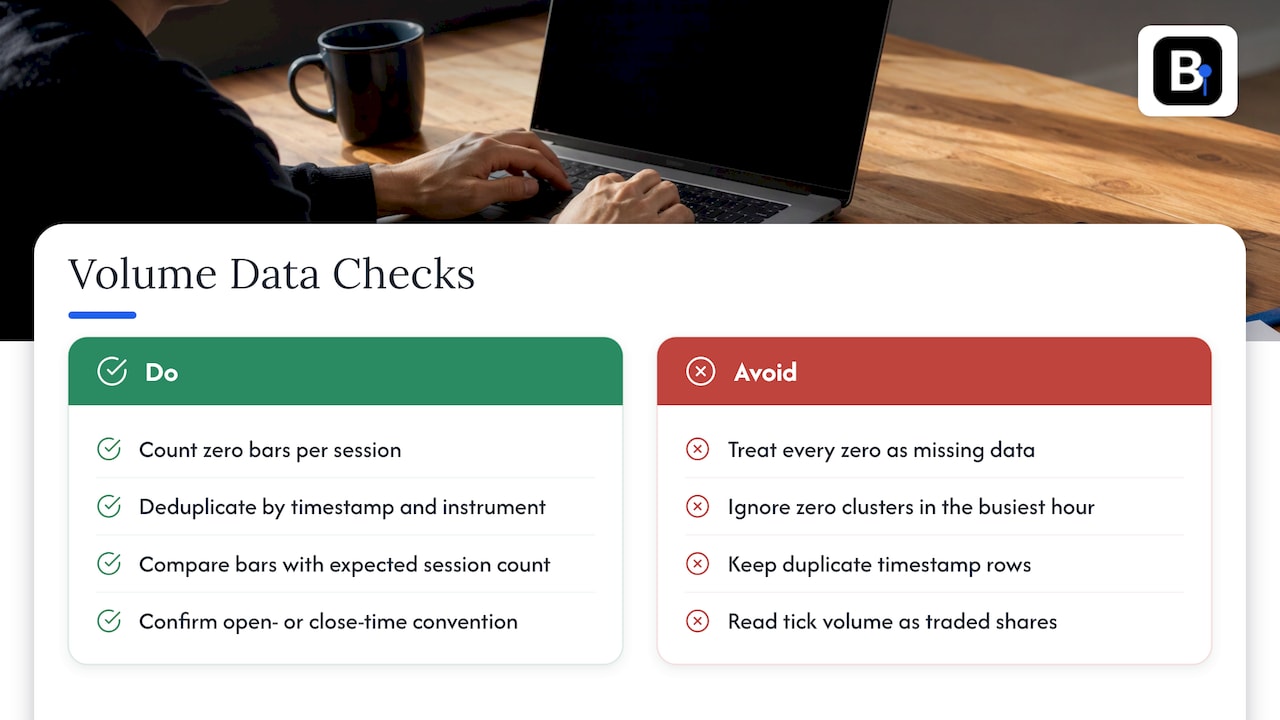
Duplicated bars. Two rows with the same timestamp double-count that minute's volume and pull VWAP toward it. Deduplicate on timestamp and instrument before any calculation, and check that the surviving row is the right one.
Missing bars. VWAP does not need continuous bars, but a missing high-volume minute changes the line for the rest of the session. Compare the bar count per session with the expected count for that instrument's hours.
Shifted timestamps. Some sources stamp a bar with its open time, others with its close time. A one-bar shift moves volume to the wrong minute and misplaces the reset. Confirm the convention and apply it consistently.
The wrong kind of volume. In spot forex there is no central tape, so the volume in a minute bar is typically a count of price updates (tick volume), not shares or lots traded. VWAP built on it is a tick-weighted average price, which is a legitimate tool as long as you know that is what it is. See our guide to tick volume versus real volume for forex traders before you interpret a forex VWAP the way you would an equity one.
A validation workflow you can audit
Before a VWAP rule goes into a strategy, run it through this short routine:
- Fix the definition. Typical price or close, session boundaries, timezone, bar timestamp convention. Write them down.
- Test on a tiny sample. Reproduce the five-bar table above by hand or in a spreadsheet and compare to your code to the cent.
- Check data integrity. Duplicates, zero-volume counts, bars per session, gaps around holidays and half days.
- Compare across sources or intervals. Compute VWAP from 1-minute bars and from your finest available data for a few days. Differences should be small and explainable.
- Check the reset. Plot one full day and confirm the line restarts where you intend, including on daylight-saving change days.
- Freeze the dataset. Record the data version used for each backtest so results can be reproduced.
Step 6 is underrated. If the data you test on changes quietly between runs, you cannot tell a strategy improvement from a data change. Our overview of minute-bar backtesting accuracy covers more of this checklist.
Limits to build into the backtest
VWAP from minute bars is excellent for a reference level and for benchmarking, and a few modeling points keep a test honest:
- Look-ahead. The VWAP of a minute includes that minute's own volume. If your signal fires on that bar's close, you can only fill on the next bar. Using the same bar's VWAP to trade at that bar's price is a look-ahead error.
- Fills and slippage. Assuming you fill exactly at VWAP flatters results for anything but small orders. Model the cost, for example with a simple minute-bar slippage formula.
- Early-session instability. The first minutes of a session carry few observations, so VWAP hugs the price. Many rules wait for a minimum volume or number of bars.
- Bar interval choice. Signals that look good at one interval can vanish at another, which is worth checking with a signature plot of 1-minute versus 5-minute bars.
- Roll and adjustment handling. On futures, a VWAP that runs across a contract roll mixes two price levels unless the series is back-adjusted and the reset is anchored properly.
Our perspective
Most VWAP questions we see are really data questions. The formula fits on one line, but the result depends on whether every minute is present once, stamped consistently, with a volume field that means what you think it means.
That is why we build and maintain complete minute-bar datasets since 2014 across forex, metals, bonds and stock indices, verified bar by bar, with adjustments documented. You download the full set once, import it straight into MT4 or MT5, and the VWAP you compute tomorrow uses the same bars as the one you computed today.
The engineers who collect the data also answer support questions, so a question about timestamps or session boundaries goes to the people who know the answer. Our standard is built for both human and AI-driven backtesting, because a model will exploit a data flaw just as readily as a person misreads one.
Start
From formula to a dataset you can trust
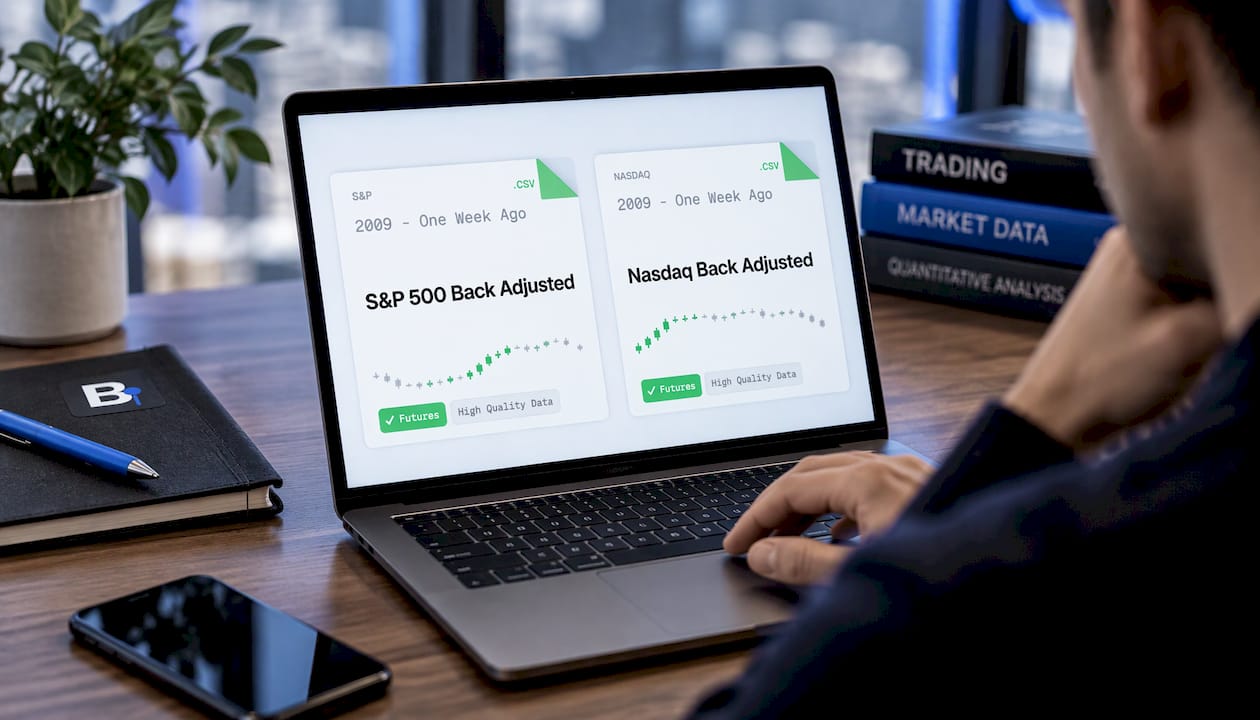
Once your VWAP code matches the hand-worked example, the remaining risk is the input. Our Historical Data page lists complete minute-bar datasets by asset class, ready to import into MT4 and MT5. If you test across a range of instruments and want everything under one roof, the Annual Plan is €119 per year. For index-futures work, our back-adjusted series such as S&P 500 Back Adjusted 1mo and Nasdaq Back Adjusted 1mo keep prices continuous across rolls, which matters when you anchor a VWAP to a multi-day event.
If you are still deciding how much data you need, our guide to what historical market data costs and when to buy once walks through the price bands.
FAQ
How do I calculate VWAP from 1-minute data?
Compute the typical price (high + low + close) ÷ 3 for each bar, multiply by the bar volume, and divide the running sum of those products by the running sum of volume. Restart both sums at the start of each session. The five-bar example above shows each step.
Should I use the close or the typical price?
Both are used in practice: QuantConnect's LEAN uses the typical price for trade bars, and PyAlgoTrade lets you choose either. The difference is usually small but systematic. Pick one, document it and apply it everywhere, in research and in live trading.
Why does VWAP look different on a 1-minute and a 5-minute chart?
Because each chart builds it from different inputs. Unless the study reads the underlying data, it works from each bar's summary values, so coarser bars give a coarser approximation. Sierra Chart's documentation describes this behavior. Calculate on your finest bars and keep the interval constant.
Does VWAP work with forex data?
Yes, with a caveat on meaning. Spot forex has no single tape, so minute-bar volume is usually tick volume, a count of price updates. The result is a tick-weighted average price, useful as a consistent intraday reference as long as you treat it that way.
When should VWAP reset?
For a session VWAP, at the session open you define, with the timezone and extended-hours choice fixed. For an anchored VWAP, at the bar of the event you study. Rolling VWAP does not reset, it only drops old bars.
Sources
- Volume Weighted Average Price (VWAP), TradingView
- IntradayVwap.cs source file, QuantConnect LEAN
- pyalgotrade/technical/vwap.py, PyAlgoTrade
- Studies Reference, Sierra Chart
Recommended
- Quants: 3 Places to Download Verified OHLCV Minute Data
- Four Forex Minute Data Sources for Quants Ready for MT4/MT5
- Quant Traders: One Line Fill Formula to Simulate Minute Bar Slippage
- Resampling Minute Data in pandas: Catch Thin Buckets Before Backtests
Related resources
Explore BacktestMarket's Expert Advisor robots to put the ideas in this article into practice.