Backtesting is a necessary step in strategy development. But not all backtests are created equal. A strategy that looks impressive on paper may simply be a well-fitted curve to past data — one that has no genuine predictive power going forward.
Walk forward analysis is the methodology designed to tell the difference.
The Core Problem: Over-Fitting
When you optimise a strategy on a historical dataset, you are searching for parameter values that maximise performance on that specific data. The more parameters you optimise and the more combinations you test, the more likely you are to find a combination that appears to work — not because it captures a genuine market inefficiency, but because it fits the noise of that particular historical period.
This is over-fitting (also called curve-fitting). An over-fitted strategy will perform well on its in-sample data and fail on any new data it encounters — including live trading.
Signs your strategy may be over-fitted:
- It performs substantially better on the optimisation period than on a held-out validation period
- It requires many precise parameters to work (e.g. "exactly" RSI(14) and "exactly" a 23-period moving average)
- Performance degrades rapidly when you slightly change any parameter
- It has very few losing trades in the backtest
What Is Walk Forward Analysis?
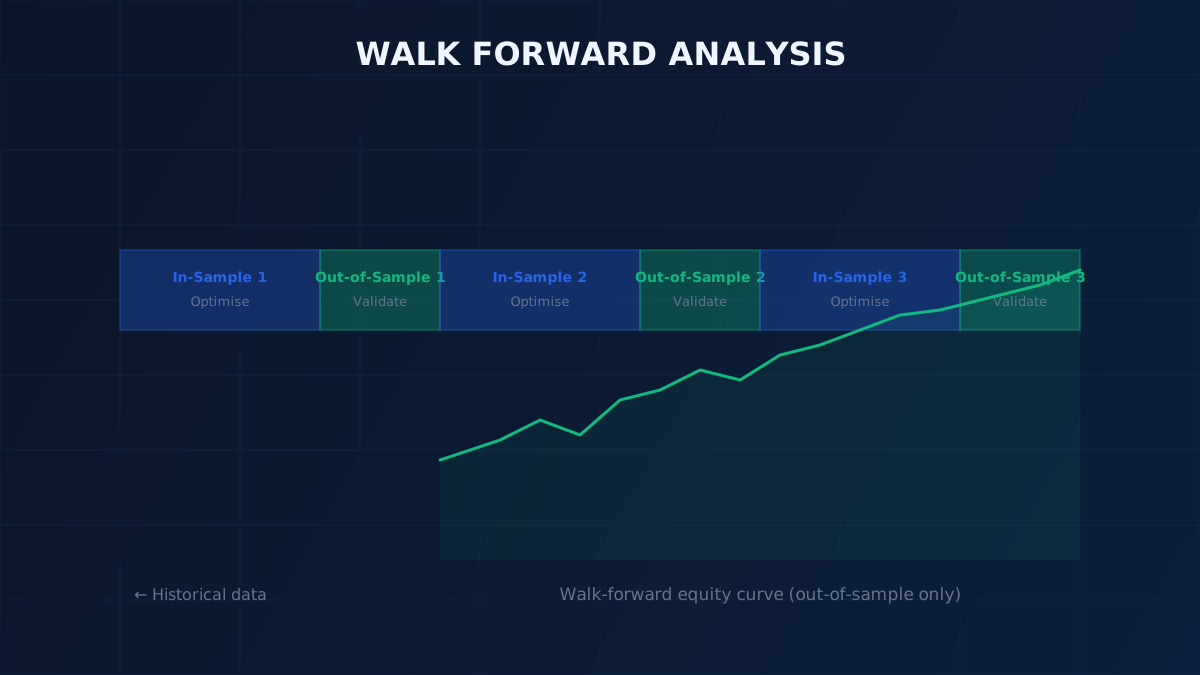
Walk forward analysis (WFA) is a structured methodology for validating a trading system across multiple non-overlapping time periods. It simulates the real-world process of developing, deploying, and periodically re-optimising a strategy.
The basic process:
- Divide your historical data into a series of sequential windows
- Optimise the strategy on the first window (in-sample)
- Test the optimised parameters on the immediately following window (out-of-sample) — do not re-optimise
- Record the out-of-sample results
- Move forward one window and repeat
The final result is a sequence of out-of-sample performance periods, each tested with parameters that were never seen by the optimiser. Stitching these periods together gives you the walk forward equity curve — the most honest estimate of how the strategy would have performed historically.
Walk Forward in MetaTrader 4
MT4 does not have a dedicated WFA tool built in, but you can perform it manually:
- Load your full historical data into MT4
- Set the Strategy Tester date range to cover the first half of your data (in-sample period)
- Run the optimisation to find the best parameter set
- Without changing the parameters, set the date range to the second half (out-of-sample period)
- Run a single backtest (no optimisation) with the parameters from step 3
- Compare in-sample and out-of-sample performance
If out-of-sample performance is broadly similar to in-sample performance — perhaps somewhat worse, but following the same general shape — the strategy is likely robust. If it collapses entirely on the out-of-sample period, it was over-fitted.
Good Practices While Backtesting
Beyond walk forward analysis, these practices improve the validity of your backtest results:
Build on Financial Logic, Not Data Mining
The best trading systems are built on a coherent theory of why a market pattern should exist — not on finding whatever combination of parameters happened to work in the past. A strategy based on sound market microstructure or behavioural finance has a reason to persist. A strategy based on "RSI(14) and three moving averages" has only the evidence that this combination worked historically.
Start with the why, then test whether the data supports it.
Test the Complete System, Not Individual Rules
Testing each rule of a multi-condition strategy in isolation and combining the "best" rules is a form of over-fitting. The interaction between rules matters. Build and test the system as a whole.
Use Sufficient Data
A backtest on 2 years of data with 50 trades tells you almost nothing statistically. Aim for:
- At least 5–10 years of data covering multiple market regimes (trending, ranging, high-volatility, low-volatility)
- At least 200–300 trades for statistical significance
The more conditions and parameters your strategy has, the more data you need to avoid spurious results.
Stress Test Across Instruments
A genuinely robust strategy should show similar edge characteristics when applied to related instruments. A trend-following system on EUR/USD should also show evidence of edge on GBP/USD, USD/JPY, and other liquid pairs — not just the one you optimised it on.
Account for Real-World Costs
Set spreads in your backtest to at least double the typical broker spread for that instrument. Add commission costs if your broker charges per-lot fees. These adjustments are particularly important for short-term strategies where transaction costs consume a larger share of the trade's expected value.
Never Over-Optimise
When you run an optimisation and review the results, choose parameter values from a robust zone — a range where performance is consistently good — rather than the single best-performing parameter set. If your strategy only works with RSI(14) but not RSI(13) or RSI(15), the edge is not real.
Walk forward analysis and these backtesting practices do not guarantee a profitable strategy. What they do is dramatically reduce the risk of deploying a strategy that only appeared profitable because of how it was tested. The extra rigour is worth the additional time.