

Weekend gap modeling means turning the jump between Friday's last price and the Sunday or Monday reopening price into a measurable, repeatable variable. You define the gap with one formula, filter out noise, classify gaps by size, test whether size predicts anything, and then simulate trades with realistic fills. The weak link is rarely the statistics. It is usually the data: a bad Friday print or a stray Sunday tick can turn a boring week into a fake 80-pip "gap" that your backtest happily trades.
This guide walks through the full workflow, from definition to execution, with the cleaning checks that decide whether your results can be trusted.
TL;DR
- A weekend gap is the reopening price minus the last pre-close price. Divide by the prior close to get a percentage, or by pip size for currency pairs.
- The same weekend prints different gaps on different feeds, so every gap you record must carry its instrument, feed and timestamps.
- Apply a minimum size filter, classify gaps by magnitude, and test fill probability with survival or logistic methods rather than anecdotes.
- Published academic work suggests gap behavior may be a by-product of broader volatility, so test against matched non-gap periods before you trust a "gap fill" edge.
- Clean minute bars, instrument-specific calendars and next-bar execution keep gap backtests free of phantom profits and look-ahead bias.
Table of Contents
- What a weekend gap is and how to measure it
- Why prices gap over weekends
- How gaps differ across markets
- A workflow for modeling weekend gaps
- Data quality: telling a real gap from a bad print
- Backtesting gap rules without fooling yourself
- Perspective: why clean minute bars decide gap research
- Get the data your gap model needs
- FAQ
- Sources
What a weekend gap is and how to measure it
A weekend gap is the difference between the last price before a market closes for the weekend and the first price when it reopens. The standard construction is simple: gap = reopening price minus Friday's close. A positive number is a gap up, a negative number is a gap down, and dividing by Friday's close expresses it as a percentage.
The definition hides three choices that change your numbers:
- Which close. For US stocks the regular session ends at 4:00 p.m. Eastern, but futures and extended-hours quotes keep trading afterward. The difference between a cash close and a later print matters, and the article on closing price versus intraday prices explains why the official close is treated as the benchmark.
- Which open. In spot forex, trading resumes on Sunday around 5 p.m. New York time after a roughly 48-hour break, according to OANDA's guide to forex price gaps. Some traders use the first tick, others the first completed bar.
- Which units. Pips suit currency pairs, points suit indices, and percentages let you compare across instruments.
Some trading communities formalize the idea further. In ICT-style teaching, the New Week Opening Gap is the band between Friday's 17:00 New York close and Sunday's 18:00 New York open, with its midpoint called consequent encroachment, as described in this glossary entry. The same entry makes a point worth keeping: the construction is exact, but the claim that price returns to the band or reacts at its midpoint is a statement about distributions that needs empirical verification against matched non-gap levels.
Why the feed matters
In spot forex there is no single tape. Each broker's last Friday quote and first Sunday quote can differ by several pips, so the same week prints different gaps on different platforms, as the same source notes. A gap quoted without its instrument and feed cannot be reproduced. Store both alongside every gap record.
Why prices gap over weekends
News does not stop when the market does. Central bank comments, economic data and geopolitical events accumulate while trading is closed, and the reopening price reflects all of it at once. Fewer participants in the first minutes can also mean wider spreads and bigger swings.
Futures show the mechanism clearly. CME equity index futures such as E-mini S&P 500, Nasdaq-100 and Dow close Friday afternoon and do not reopen until 6:00 p.m. ET on Sunday, leaving a window of roughly 48 hours with no price discovery, as EdgeClear explains. Forex gaps commonly appear at the Sunday 5 p.m. reopening and can follow economic releases or geopolitical events, per OANDA.
For modeling, this gives you two useful ideas:
- Gap size reflects information that arrived during the closure. A quiet weekend produces a small gap, while a policy shift or political shock produces a large one.
- The gap is not a normal return. A weekend return is a reconciliation of accumulated information rather than continuous price discovery. Quantitative practitioners have long argued that weekend returns differ statistically from weekday returns, and that linear models should exclude weekend bars from training and should not try to predict weekend returns or the first few bars of a week, as Ernest Chan's note on data gaps puts it.
How gaps differ across markets
The calendar defines the gap, so the same word means different things by asset class.
| Market | Typical pre-weekend reference | Reopening reference | Modeling note |
|---|---|---|---|
| Spot forex | Friday late-day New York close | Sunday around 5 p.m. New York | Feed-dependent, so always record the source |
| US stocks | Friday 4:00 p.m. Eastern close | Monday 9:30 a.m. Eastern open | Compare the cash close with the cash open, and treat extended hours as separate |
| Equity index futures | Friday afternoon close | Sunday 6:00 p.m. ET | The futures reopening can precede the cash market by many hours |
| Spot crypto | None, it trades continuously | None | Gap talk usually refers to CME futures, not spot |
Index traders in particular need to separate cash sessions from futures sessions. Our guide to index trading hours lays out how the two calendars differ, and why mixing them creates gaps that never existed in the market you intended to trade.
A workflow for modeling weekend gaps
Step 1: Fix the definition
Write down the close and open rule before you look at any results. A useful distinction is between an open-based gap (Friday's final price to the reopening bar's opening price) and a settled gap that measures to the end of the first reopening period. The first print after a long break can be thin and unrepresentative, so a settled variant is often more robust for directional work. Whichever you choose, keep it fixed across instruments.
Step 2: Filter out noise
Tiny gaps of a tick or two inflate fill rates, because they close almost instantly. Two filters are common:
- A fixed threshold. One academic study of the DJIA, NASDAQ and DAX counted a gap whenever Monday's open differed from Friday's close by more than 20 points. Using 5-minute data from 2013 to 2023, it found 205 gaps in the DJIA, 270 in NASDAQ and 406 in the DAX, according to the paper in the Journal of Risk and Financial Management.
- A volatility-scaled threshold. Setting the minimum gap as a fraction of recent average range lets the filter adapt when volatility changes. If you use a range-based tool, the Average Range indicator can help you scale thresholds on MT4 or MT5.
Step 3: Classify by magnitude
Bucket gaps by size, for example by percentile of your own history or by multiples of average range. Report, per bucket: count, direction, time to fill, partial fills and maximum adverse excursion before the fill. Averages across all gaps hide the fat tail, where a handful of large weekends dominate risk.
Step 4: Pick methods that fit the question
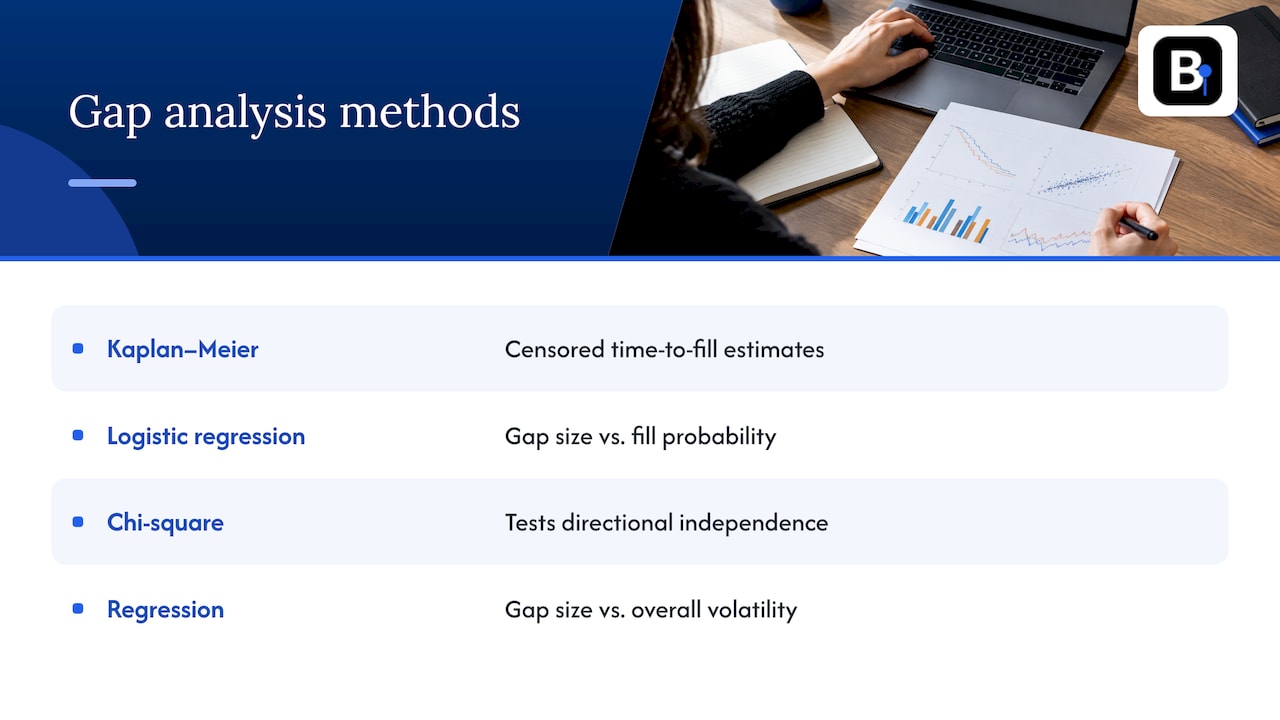
Traders commonly use Kaplan-Meier estimates for time-to-fill and logistic regression for whether gap size relates to the probability of filling back to Friday's close, as this MQL5 research article outlines. The reasoning is sound: a gap that has not filled yet is censored data, and survival methods handle that correctly where a simple average does not.
The academic work adds a cautionary angle. The authors of the study above use Chi-square tests for independence to check directional bias and regression to ask whether larger gaps go with greater overall volatility, and they argue that apparent gap-closing may simply be a by-product of broader equity volatility rather than a true closing tendency (MDPI, 2025). Treat that as a design requirement: compare gap behavior with matched non-gap levels and volatility regimes, so you know what is gap-specific.
Step 5: Stress the tail
A fill rate can look excellent while one weekend does the damage. Sort your results by worst adverse excursion and check how many of the worst outcomes cluster in the same event. If a handful of weekends explain most of the drawdown, size positions for that tail, not for the median.
Data quality: telling a real gap from a bad print
Gap studies amplify data errors. A single wrong Friday close or a spurious Sunday tick creates a gap that is entirely fictional, and since gaps are rare events, a few fake ones can dominate your statistics. Before modeling, run these checks:
- Spike test. A genuine gap persists: the bars after the reopening trade near the new level. A bad tick snaps back within a bar or two. Our three-condition spike test formalizes this for minute data.
- Cross-check the reference prices. Compare Friday's last bar and Sunday's first bar with a second source or with neighboring instruments. If EUR/USD gaps 60 pips but EUR/GBP and EUR/JPY do not move accordingly, suspect the data.
- Verify the timestamps. Time zone shifts and daylight saving changes can move the "first bar" by an hour and manufacture or erase a gap. Use one consistent time standard and a calendar that follows daylight saving through its time zone.
- Look for missing bars. A hole at the end of Friday means your "last price" is not the last price. Our 5-step audit for missing bars shows how to detect and classify them.
- Separate weekends from holidays. A Monday holiday creates a longer closure and often a larger gap. Handle it deliberately, as described in our holiday gaps guide.
- Remove flat weekend bars. Some feeds fill Saturday and Sunday with stale bars that dilute volatility and hide the true reopening. See three ways to remove weekend bars.
Trading calendars deserve their own mention. Good data practice uses instrument-specific calendars to tell weekends, holidays and regular sessions apart, with bars on a fixed UTC grid, as the qkt documentation on trading calendars describes. The same reasoning appears in a rundown of common backtesting pitfalls, where data handling errors sit alongside overfitting as ways a backtest can overstate live results.
If you trade in MetaTrader, a per-year audit of gaps and modeling quality is also worth doing, and we cover it in our MQL4 data preparation guide.
Backtesting gap rules without fooling yourself
A gap strategy is exposed to three specific traps.
Look-ahead bias. You cannot know Sunday's reopening price on Friday, and you cannot know the gap's final size from the first print if your rule uses the close of the first hour. Define when the signal becomes known and trade only after that moment. Our look-ahead bias checklist walks through the leaks that most often survive sign-off.
Unrealistic fills. A stop order placed below Friday's close does not fill at your stop price if the market reopens beyond it. It fills at the first available price, which can be far worse. In a bar-based simulation, evaluate rules after a bar completes and fill at the next bar's open, with slippage on stops and limit orders filling only when the bar's range includes the limit. For minute bars, a simple fill formula can approximate slippage, as shown in our piece on simulating minute-bar slippage.
Spread blindness. Spreads are typically wider right after a reopening, and the first minutes are the ones a gap strategy trades. Use a spread assumption that reflects the reopening window, not the quiet midday average.
A short checklist before you trust a result:
- Is the gap definition fixed and written down before testing?
- Do you have at least a few hundred gaps per instrument, or are you reading noise?
- Do results survive removal of the single worst weekend?
- Does the edge persist against matched non-gap periods?
- Do fills use next-bar prices and realistic reopening spreads?
Perspective: why clean minute bars decide gap research
Gap research is unusual because the entire result depends on two prices a weekend apart. In most strategies a single bad bar is diluted by thousands of good ones. In a gap study, a single bad bar can be the signal itself.
That is why we built our datasets around bar-by-bar verification, documented adjustments and a strict quality standard. When our engineers collect the data, we look at exactly the places gap studies break: the last bar before the close, the first bar after the reopening, daylight saving transitions and holiday closures. Our aim is that the data you import into MT4 or MT5 behaves the way the market did.
Our view is that a backtest is only as honest as its inputs. Whether a human reviews the results or an AI-driven process does, the data should arrive clean, complete and ready to import, so your time goes into modeling, not repairing files.
Start
Get the data your gap model needs
If you are building a gap study, start with minute-bar history that has been checked at the weekend boundaries. Our Historical Data page covers forex, metals, stock indices, bonds and commodities from 2014, delivered as complete downloads that import straight into MT4 and MT5. If you prefer ongoing access, the Annual Plan is €119 per year.
Our engineers answer support questions directly, so if you are unsure how a dataset treats a specific weekend or holiday, you can ask the people who collect it. You can also browse our Expert Advisors and Indicators for tools that fit into a systematic workflow.
FAQ
How do you calculate a weekend gap?
Subtract Friday's closing price from the reopening price: a positive result is a gap up, a negative one a gap down. Divide by Friday's close for a percentage, or by pip size for currency pairs. Keep the same close and open definitions across your whole sample.
Do weekend gaps always fill?
No. Many gaps do retrace, but a fill rate depends on your gap definition, your minimum size filter and your time window. Academic work suggests apparent closing may be tied to broader volatility rather than a gap-specific tendency, so test against matched non-gap periods and look closely at the largest gaps.
Does crypto have weekend gaps?
Spot crypto trades continuously, so it does not have the same weekend closure. Gaps people discuss in this market usually come from CME Bitcoin futures, which follow an exchange calendar with a weekend break. Model them as a futures-calendar effect.
Why do different brokers show different weekend gaps?
Spot forex has no single tape, so each broker's last Friday quote and first Sunday quote can differ by several pips. The same weekend can therefore print different gaps. Record the instrument and feed with every gap, and run your whole study on one consistent dataset.
How do I avoid bad ticks creating fake gaps?
Check that the new price level persists across following bars, compare the reference prices with a second source, confirm timestamps and daylight saving handling, and look for missing bars around the close and reopening. Clean minute bars make these checks far quicker.
Sources
- Price Gaps and Volatility: Do Weekend Gaps Tend to Close? (MDPI)
- Price gaps in forex: types, causes, and how to trade them (OANDA)
- CME Weekend Gap Risk: How Futures Traders Can Prepare (EdgeClear)
- New week opening gap (NWOG) in ICT (Hadal Instruments)
- Quantitative Trading: Time series analysis and data gaps
- From Novice to Expert: Weekend Gap Size Effect Research (MQL5)
- Trading calendars (qkt docs)
- Closing Prices vs. Intraday Prices (MarketCapLens)
- The Seven Backtesting Pitfalls That Destroy Live P&L
Recommended
- Holiday Gaps in Market Data: A Quant's Handling Guide
- 3 Ways to Remove Weekend Bars From Forex Data for Backtesting
- 99% Modeling Quality for Quants: MQL4 Data Prep Per Year Gap Audit
Related resources
Explore BacktestMarket's historical data packs to put the ideas in this article into practice.