When you run a backtest in MetaTrader 5, the Strategy Tester spits out a report packed with numbers. Drawdown, expected payoff, Sharpe ratio, recovery factor — and right near the top of that list sits profit factor. It looks simple enough: one number that tells you whether your EA made more than it lost. But knowing what a good profit factor actually looks like — and more importantly, what it means in context — is where most retail algo traders get tripped up.
This article explains what profit factor measures, what benchmarks are realistic for different trading styles, and why you should never evaluate it in isolation.
What Profit Factor Actually Measures
Profit factor is calculated by dividing the gross profit of all winning trades by the gross loss of all losing trades over the test period.
Profit Factor = Gross Profit ÷ Gross Loss
A profit factor of 1.0 means the EA broke even — wins and losses cancelled out exactly. Anything above 1.0 means the strategy returned more than it lost in raw dollar terms. Anything below 1.0 means the opposite.
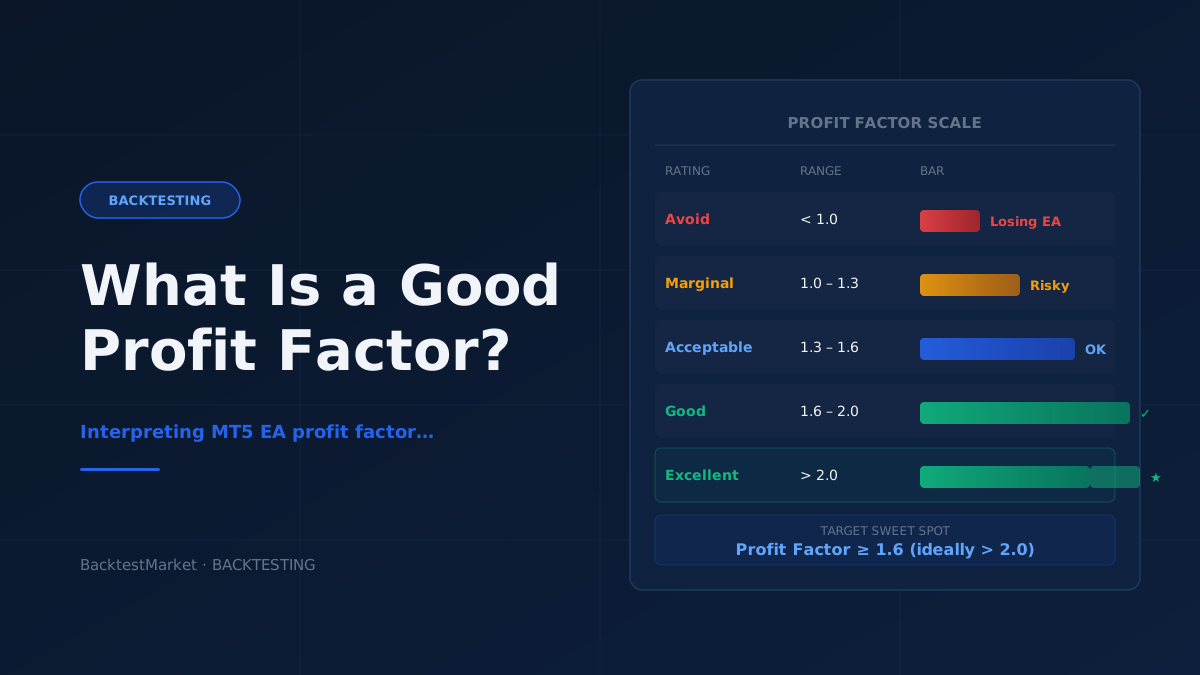
Here is a quick reference for how to interpret the number at a headline level:
| Profit Factor | General Interpretation |
|---|---|
| Below 1.0 | Net losing strategy |
| 1.0 – 1.25 | Marginal; highly sensitive to costs |
| 1.25 – 1.50 | Acceptable for high-frequency or scalping EAs |
| 1.50 – 2.00 | Solid range for most swing/trend-following EAs |
| 2.00 – 3.00 | Strong — worth deeper investigation |
| Above 3.00 | Exceptional or potentially overfitted |
These are not hard rules. They are practical starting points, and the rest of this article explains why the context surrounding them matters far more than the number itself.
One thing profit factor does not tell you is how consistent those profits are distributed over time. Two EAs can both report a profit factor of 1.8, yet one generates steady returns across all market conditions while the other made almost everything in a single three-month bull run. The metric treats all periods equally, which is both its strength (simplicity) and its limitation.
What Counts as a "Good" Profit Factor Depends on Your EA Type
There is no universal target. A profit factor threshold that is completely reasonable for one type of Expert Advisor can be a red flag for another. Here is how to calibrate your expectations by strategy style.
Scalping and High-Frequency EAs
Scalping strategies take a large number of trades, often targeting small pip gains. Because each trade earns very little, the gross profit column builds up slowly. A profit factor of 1.25 to 1.50 is often considered acceptable here, provided the EA was tested with realistic spreads, commission, and slippage baked in. Many scalping backtests look dramatically better when tested on fixed spreads rather than variable spreads from quality tick data. Always verify your test environment reflects real broker conditions.
Trend-Following and Swing EAs
These strategies take fewer trades and aim for larger moves. Wins tend to be bigger, losses tend to be cut shorter, and the hold time per trade is measured in hours or days. A profit factor in the 1.50 to 2.50 range is a realistic and healthy target. If a trend-following EA only achieves 1.2, the win-rate/risk-reward combination probably does not give you enough cushion to survive drawdown periods without the equity curve grinding sideways for months.
Mean-Reversion EAs
Mean-reversion strategies often have high win rates but smaller average wins relative to their occasional large losses. Profit factors in the 1.40 to 2.00 range are common. Be especially vigilant about tail-risk events: a single gap or news spike can wipe out weeks of accumulated profit in one losing trade, which can drastically deflate a profit factor figure in live trading that looked fine in backtesting.
Grid and Martingale EAs
Grid systems and martingale-based EAs routinely post profit factors of 2.0, 3.0, or higher in backtests — sometimes much higher. This is largely an artifact of how the metric works: if a strategy almost never closes a losing trade (it keeps averaging down instead), the gross loss column stays artificially low. Treat any profit factor above 2.5 on these strategy types with significant scepticism and focus far more heavily on maximum drawdown and the equity curve shape.
Why Profit Factor Alone Will Mislead You
Experienced algo traders use profit factor as one input in a broader evaluation framework — not as a pass/fail gate on its own. Here are the most important things to read alongside it.
Number of Trades
A profit factor of 2.5 across 12 trades is statistically meaningless. A profit factor of 1.65 across 1,400 trades is meaningful. MT5's Strategy Tester makes it easy to see total trade count in the same report — if your sample is small, your profit factor has wide confidence intervals and could easily flip in live trading.
A practical minimum before placing serious weight on the metric is somewhere around 200–300 closed trades. More is better.
Maximum Drawdown
A high profit factor with a high drawdown is a common profile for strategies that have had one excellent period that masks significant pain elsewhere. An EA with a profit factor of 2.1 and a maximum drawdown of 45% is probably not manageable for most retail accounts. Pairing profit factor with the recovery factor (net profit divided by max drawdown) gives you a more complete picture of risk-adjusted performance.
Test Period and Data Quality
This point cannot be overstated. A backtest run over 12 months of recent data on a single currency pair tells you very little about robustness. A backtest run over 10+ years, across multiple instruments and market regimes, tells you substantially more.
The quality of the historical data used matters just as much as the length. MT5's built-in data download is convenient but not always precise enough for strategies that depend on tick-level accuracy. Using high-quality tick data — the kind that captures every bid/ask movement rather than OHLC bars — can produce meaningfully different profit factor results compared to lower-resolution data. You can find properly formatted historical data packs for MetaTrader 5 that are purpose-built for this kind of rigorous testing.
In-Sample vs. Out-of-Sample Performance
If you optimised your EA's parameters on the same data you used to calculate its profit factor, that number is not a backtest result — it is a curve-fit score. Proper walk-forward analysis or an untouched out-of-sample test window is required before a profit factor figure carries real weight. A strategy that shows a profit factor of 1.9 in-sample and 1.7 out-of-sample is far more credible than one that shows 2.4 in-sample and 0.9 out-of-sample.
A Practical Framework for Evaluating Profit Factor in MT5
Rather than chasing a target number, use profit factor as part of a structured checklist:
- Check the trade count. Is it statistically sufficient (200+ trades minimum)?
- Check the test period. Does it span multiple years and different volatility regimes?
- Check the data quality. Was variable spread and commission included? Was tick data used?
- Check the drawdown. Is the profit factor high because the strategy genuinely performs well, or because drawdown periods were not captured in the test window?
- Check the out-of-sample result. Does profit factor hold up on data the EA was not optimised on?
- Check the strategy type. Adjust your expectations based on whether you are evaluating a scalper, swing trader, or grid system.
If an EA clears all six of these checkpoints with a profit factor comfortably above 1.5, you have something worth taking seriously. If it fails two or more checkpoints but shows an impressive headline number, treat that number as a warning sign rather than a green light.
Practical Takeaway
Profit factor is a useful, easy-to-read metric — but it is not a verdict on its own. For most EA styles on MT5, a profit factor between 1.5 and 2.5, backed by a sufficient trade count, quality tick data, and a clean out-of-sample result, represents a credible and potentially robust strategy. Numbers much higher than 3.0 should prompt more scrutiny, not less.
If you want to see how well-constructed backtests present and contextualise profit factor alongside other key metrics, browse the ready-made Expert Advisor robots and backtests available on BacktestMarket — each one comes with a full Strategy Tester report so you can evaluate the numbers yourself before making any decisions.
Understanding what you are looking at is the first step. Testing rigorously on quality data is the second. Everything else follows from there.