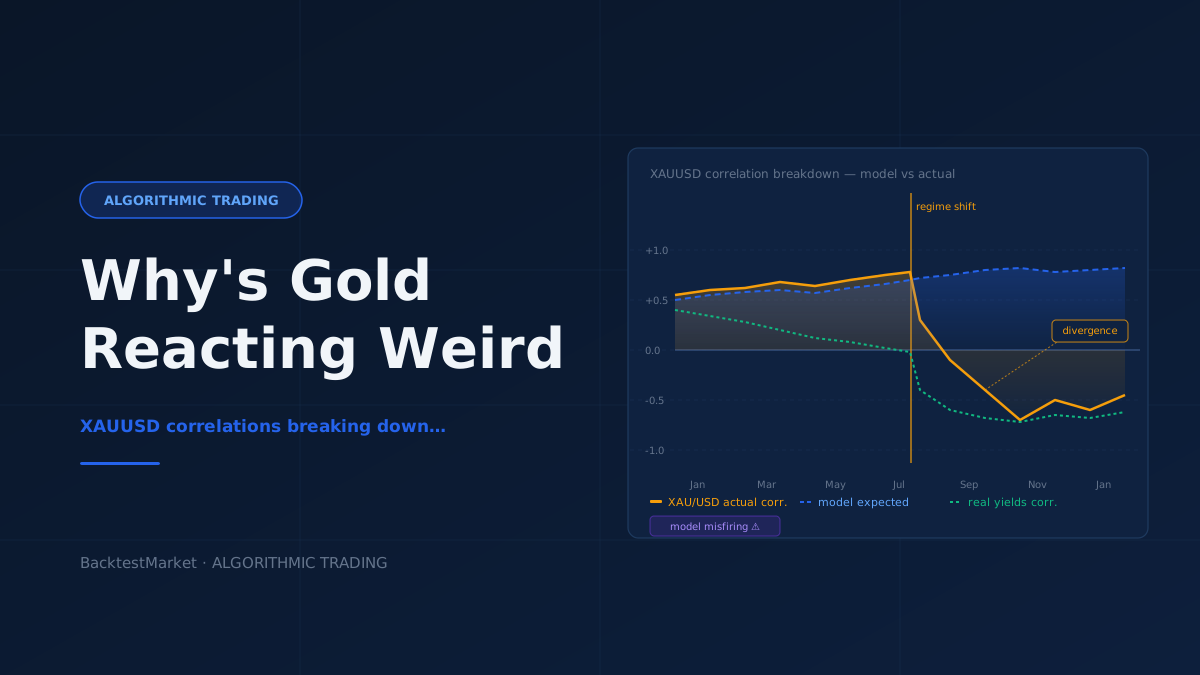
If you've been running a gold trading strategy lately — whether it's a trend-follower on the daily chart or a mean-reversion scalper on M15 — there's a reasonable chance you've noticed something feels off. Setups that used to resolve cleanly are stalling, reversing, or just going nowhere. Price spikes look like stop hunts even when the news backdrop seems clear. The correlations you've been leaning on — DXY inverse relationship, real yields as a lead indicator, VIX-driven safe-haven flows — seem to be working only part of the time, or not at all.
You're not imagining it. Gold's behavior has genuinely shifted. This article won't tell you whether gold is going up or down. What it will do is break down why price action has become harder for systematic models to digest, and give you a practical framework for diagnosing the problem in your own backtests and live strategies.
The Correlations You've Been Relying On Are Regime-Dependent
Most retail algorithmic traders who trade XAUUSD have built their edge — consciously or not — around a handful of well-documented macro relationships:
- Dollar (DXY) inverse correlation: Gold priced in USD tends to move inversely with dollar strength.
- Real yields (US 10Y TIPS): Rising real yields raise the opportunity cost of holding gold (no yield), so gold tends to fall.
- Risk-off / safe-haven demand: Equity drawdowns, geopolitical flare-ups, and credit stress tend to push flows into gold.
These correlations are real. They're grounded in economic logic and have shown up clearly in long-run historical data. The problem is that every one of them is regime-conditional. They hold strongly in some market environments and break down in others.
What we've been experiencing across 2025 and into 2026 is a period where multiple regime-shifting forces collided simultaneously: central bank gold accumulation (particularly from non-Western central banks) running at elevated levels, persistent fiscal uncertainty in major economies, and a geopolitical reordering that changed who the marginal buyer of gold actually is. When the marginal buyer is a sovereign wealth fund or a central bank operating on multi-year mandates rather than a macro hedge fund reacting to this week's CPI print, the short-term signal-to-noise ratio in your correlations degrades significantly.
For your algorithmic strategy, this matters in a very concrete way: if your model's logic is built on dollar weakness → gold long, and that input-output relationship has decoupled, your model doesn't stop trading. It keeps firing signals into a market that no longer responds to those signals the way your backtest expected.
Regime Breaks Are the Most Dangerous Gap Between Backtest and Live Performance
This is one of the most important lessons in systematic trading, and gold is currently providing a live classroom example.
When you backtest a XAUUSD strategy over, say, 2018–2023, you're capturing a period that includes COVID safe-haven spikes, the 2022 dollar surge, post-Ukraine volatility — a rich variety of conditions. Your backtest metrics may look robust. But if the structural relationship between gold and its traditional drivers has shifted at the macro level, out-of-sample performance will diverge from in-sample performance in ways that look random from the outside but have a systematic cause underneath.
There are a few specific patterns worth checking in your own backtests:
Walk-forward degradation: Run your strategy in fixed windows (e.g., optimize on 12 months, test on the next 3, roll forward). If performance degrades sharply in the most recent windows — specifically 2025 onward — that's a signal that your parameter set was fitted to a regime that has changed, not that you've simply hit a bad luck stretch.
Correlation stability checks: Calculate the rolling 60-day correlation between your strategy's P&L and the dollar index, and separately with real yields. If the correlations that should be there (based on your strategy logic) have drifted toward zero or flipped sign, you've identified where the regime break is hitting you.
Volatility profile mismatch: Gold's intraday volatility structure has also shifted. Periods of compressed volatility are now being interrupted by sharper, shorter spikes — sometimes on no identifiable catalyst. Strategies that were calibrated to a smoother volatility profile will have stop distances that are either too tight (stopped out before the move resolves) or too wide (giving back too much on the mean-reverting spikes).
If you need high-quality historical XAUUSD tick or bar data to run these diagnostics properly, BacktestMarket's historical data packs are a reliable starting point — using clean, broker-accurate data matters a lot when you're trying to isolate whether the problem is in your model logic or in data artifacts.
How to Adapt Your Systematic Approach Without Curve-Fitting
The instinctive response to a strategy that's underperforming is to re-optimize: tweak the parameters, adjust the filters, add a new condition. Resist that instinct as your first move. Re-optimization on recent data is how you bake the current regime's quirks into your model and set yourself up for another breakdown when the regime shifts again.
A more durable adaptation process works in layers:
Layer 1: Regime identification first
Before changing any strategy parameters, try to characterize what regime you're actually in. Is volatility elevated or suppressed relative to the prior 12 months? Is the dollar correlation to gold positive, negative, or flat? Is the gold-to-silver ratio expanding or contracting (a useful macro sentiment gauge)? Treat these as regime flags, not trading signals.
If you can classify the current environment as a distinct regime — even roughly — you can then ask: does my strategy have any historical precedent for performing in this type of regime? Look back to periods like 2010–2012 (when central bank buying was also a dominant driver) rather than 2020–2022.
Layer 2: Reduce position sizing under regime uncertainty
This is mechanical, not discretionary. If your regime flags are showing conditions unlike anything in your primary backtest window, that's genuine model uncertainty — not market uncertainty. The appropriate response is to reduce position size, not to override your model with gut instinct. A strategy running at half size during an uncertain regime preserves capital and gives you data on whether the model is actually broken or just temporarily misaligned.
Layer 3: Test structural adaptations with fresh data, not retrofitted data
If you want to add a regime filter to your existing EA — say, a condition that only takes long signals when the 60-day DXY/XAUUSD correlation is below a threshold — backtest that filter on data you haven't used for any other optimization. Use a holdout period. If you've been optimizing on 2018–2023, your holdout should be 2024 onward. If the filter helps on the holdout but not the training set, you've probably found something real.
For traders running or evaluating pre-built Expert Advisors, it's worth examining whether the EA's logic includes any regime-aware filters or whether it's a pure price-action/indicator model that has no awareness of macro context. You can browse Expert Advisor robots on BacktestMarket and check what market conditions their backtests were validated against — this due diligence is easy to skip and expensive to ignore.
The Practical Takeaway
Gold acting "weird" is not a problem with gold. It's information about where we are in the macro cycle and — more practically — it's a diagnostic signal about which assumptions your strategy was built on.
Here's a simple checklist to work through before making any changes to your XAUUSD strategy:
- Run a walk-forward test on recent windows specifically. Identify when performance started diverging.
- Check rolling correlations between your inputs (DXY, yields, VIX) and gold price. Quantify how much they've drifted from your backtest period.
- Audit your volatility assumptions — are your stops and take-profit levels calibrated to a different volatility environment than the current one?
- Compare to analogous historical regimes, not just the most recent similar-looking chart pattern.
- Scale position size down until you've completed the diagnostic, not after.
The traders who navigate regime changes best aren't the ones with the most sophisticated models — they're the ones who've built the habit of interrogating their models' assumptions before the drawdown gets large enough to force the issue. Gold's current behavior is an invitation to do exactly that.