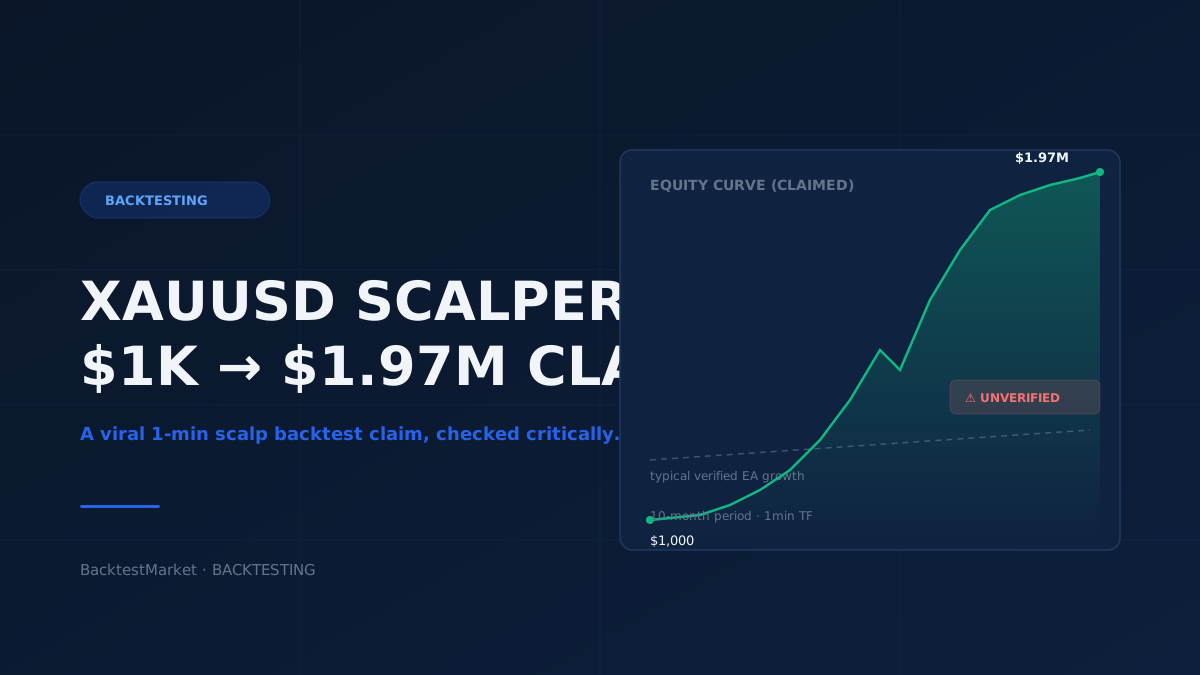
A screenshot has been circulating in algo-trading circles this week: a 1-minute timeframe XAUUSD scalper, backtested over a 10-month window, allegedly turning a $1,000 account into $1.97 million. It racked up heavy engagement on forums and Reddit threads within hours — the kind of number that gets bookmarked, screenshotted, and forwarded before anyone checks the fine print.
We're not going to reproduce or validate that specific equity curve here, and we'd encourage you to treat any unsourced percentage gain claim with the same skepticism. What we can do is something more useful: walk through why backtests like this generate numbers that look implausible, what variables are almost always doing the heavy lifting, and how you can build a repeatable process to stress-test a claim like this yourself before it ever touches a live account.
Why 1-Minute Gold Scalping Backtests Produce Eye-Popping Numbers
XAUUSD (spot gold against the US dollar) is one of the most actively traded instruments in retail forex, and it has a reputation for violent intraday ranges — moves of $15–$30 in a matter of minutes aren't unusual during London/New York overlap or around US data releases. That volatility is exactly what makes gold attractive to scalpers, and exactly what makes 1-minute backtests on gold so easy to over-state.
A few structural reasons a 10-month backtest can show triple-digit or even five-figure percentage growth:
Compounding on small account sizes. A $1,000 starting balance with aggressive position sizing (even 2–3% risk per trade) compounds extremely fast when win rate and reward ratio are favorable in the simulated environment. Multiply a few hundred trades across 10 months and the curve goes vertical on a chart — even if the absolute edge per trade is modest.
Tick data quality on the 1-minute timeframe. Most retail backtesting engines (including the strategy tester in MT4 and MT5) reconstruct intra-bar price action from available tick data. On a 1-minute chart, a single bar might only have a handful of real ticks to work with, especially on data feeds that aren't true tick-level. The platform then interpolates the rest. For a scalper that enters and exits within the same bar or two, that interpolation can materially change whether a stop-loss or take-profit was actually hit first — and in which order.
Spread and commission modeling. Gold spreads widen significantly during low-liquidity hours (Asian session, pre-NY rollover) and spike hard around news. A backtest using a fixed or average spread assumption will systematically understate the real cost of scalping XAUUSD, especially during the exact high-volatility windows that produce most of the trade signals.
Lack of slippage and requote modeling. Live execution on a 1-minute scalper routinely experiences slippage during fast markets — something a default backtest rarely accounts for unless it's specifically configured to simulate it.
None of this means the strategy is fabricated or that the person who posted it is being dishonest. It means that a headline equity curve, without the underlying assumptions disclosed, isn't something you can evaluate — and definitely isn't something you should extrapolate forward-looking expectations from.
The Hidden Variables That Make or Break a Short-Term Gold EA
If you're evaluating any 1-minute XAUUSD Expert Advisor — whether it's your own build or one you're considering from a marketplace — there's a specific checklist worth running through before you trust the equity curve:
- Data source and resolution. Was the backtest run on genuine tick data (every recorded price change) or on 1-minute OHLC data with "every tick based on real ticks" or synthetic modeling? MT5's strategy tester reports this explicitly in the test settings — check it.
- Broker spread/commission profile used. Many backtests default to the spread of whatever demo account the test was run on, which may not reflect what you'd actually get from your own broker.
- Position sizing method. Fixed lot vs. percentage-risk vs. martingale-style scaling produces wildly different equity curves from the exact same entry/exit logic. A strategy that looks linear with fixed 0.1 lots can look exponential — and far riskier — once position sizing scales with account growth.
- Drawdown, not just final balance. A 10-month test ending at $1.97 million tells you nothing about the maximum drawdown experienced along the way, or how many times the account came close to a margin call before recovering. Max drawdown and the Calmar/Sharpe-type risk-adjusted metrics matter far more for assessing whether a strategy is survivable than the terminal balance does.
- Sample size and market regime. Ten months is a relatively short window. Did it include a full range of volatility regimes — trending gold rallies, choppy consolidation, central bank surprise events? A scalper tuned to one type of market behavior can behave very differently once that regime shifts.
- Out-of-sample and walk-forward testing. Was the parameter set optimized on the same 10-month period it's being reported on? If so, this is closer to curve-fitting than to a forward-looking edge. A credible test separates optimization data from validation data.
This checklist applies whether you're looking at a free Reddit post or a paid product. It's the same due diligence process we'd recommend before licensing any Expert Advisor robot — the backtest summary is a starting point for questions, not a conclusion.
How to Stress-Test a Claim Like This Yourself
Rather than taking any single equity curve at face value, you can rebuild the test conditions and see how sensitive the results are to realistic assumptions. A practical workflow:
-
Source clean historical data. Backtest quality is bottlenecked by data quality. If you're testing on MT4/MT5, you want tick-level or high-resolution minute data that reflects real historical spreads for the instrument and period in question. BacktestMarket's forex historical data and historical data packs are built specifically to give retail traders access to this kind of granular data for exactly this purpose.
-
Import it correctly into your platform. A surprising number of "bad" backtests are actually just data import errors — timezone mismatches, gaps, or incorrect bar alignment. If you haven't done this before, our guide to importing data into MetaTrader walks through the process step by step so your test results reflect the strategy, not a data artifact.
-
Re-run with realistic spread and slippage settings. Manually widen the spread model to reflect genuine XAUUSD conditions during news and session transitions, and add a slippage buffer of a few pips on entries and exits. Watch how much the equity curve compresses.
-
Separate in-sample from out-of-sample periods. Split your 10-month window — optimize parameters on the first 6–7 months, then test unchanged on the remaining period. If performance degrades sharply, that's a strong signal the original result was overfit to that specific stretch of price action.
-
Run Monte Carlo or trade-order randomization. Shuffling the order of trades (keeping the same win/loss distribution) gives you a sense of how dependent the final equity curve is on a lucky sequencing of wins early on versus losses early on — a detail a single backtest run will never show you.
A Grounded Takeaway
A 10-month backtest showing $1,000 growing to $1.97 million is the kind of result that should prompt more questions than excitement. The headline number says almost nothing on its own — what matters is the data resolution behind it, the spread and slippage assumptions, the drawdown path, and whether the strategy was validated out-of-sample. These are the same fundamentals that separate a durable algorithmic trading framework from a curve-fitted screenshot.
If you're building or evaluating a 1-minute XAUUSD scalper of your own, start by sourcing accurate historical data, importing it correctly, and running your test with conservative cost assumptions before you let any equity curve — yours or someone else's — shape your expectations.