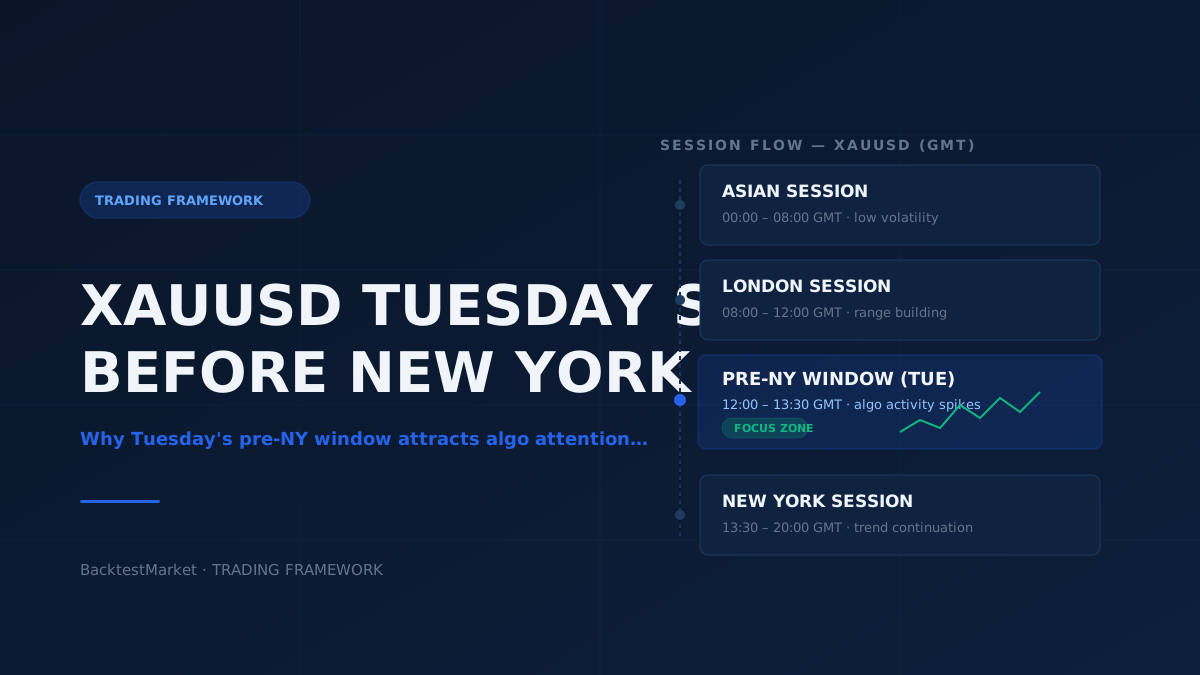
Gold traders on social platforms have been circulating a recurring theme lately: a "clean" XAUUSD setup that appears to line up specifically on Tuesdays, just ahead of the New York session open. The engagement around these posts suggests plenty of retail traders are curious about the pattern — but curiosity is not the same as edge. Before treating any session-based observation as a repeatable framework, it needs to survive contact with historical data, not just a screenshot from last week.
This article breaks down why the Tuesday pre-New York window on gold is worth structural analysis, what a disciplined backtesting approach to it looks like, and where the common pitfalls lie when traders try to turn a visual pattern into an automated strategy.
Why Tuesday and Why Pre-New York Matters Structurally
Gold's intraday behavior is heavily shaped by session overlap dynamics. The period before the New York cash open — roughly the tail end of the London morning session — is when liquidity providers, institutional desks, and algorithmic flow from both London and the incoming New York participants start to interact. This is a well-documented liquidity transition zone across FX and metals, not something unique to gold, but XAUUSD's sensitivity to USD-denominated flows and real-yield expectations makes it particularly reactive during this window.
Why Tuesday specifically? A few structural reasons show up repeatedly in market microstructure discussions:
- Monday effect exclusion. Mondays often carry residual weekend gap risk and thinner initial liquidity, which can distort session-open behavior. By Tuesday, order books have normalized and participation is more representative of "typical" conditions.
- Macro data clustering. Many recurring US economic releases (and Fed-adjacent commentary) tend to cluster in the Tuesday-through-Thursday window, historically leaving Mondays and Fridays comparatively quieter. This can create more consistent directional pressure heading into the New York open on Tuesdays specifically.
- Positioning carryover. Institutional desks often finalize weekly directional bias early in the week, and Tuesday's pre-NY window can reflect the first "clean" expression of that bias without the noise of Monday's adjustment period.
None of this constitutes a guaranteed edge — it's a plausible structural hypothesis. The job of a systematic trader is to convert "plausible" into "tested," and that's where most retail discussions of this setup stop short.
From Reddit Screenshot to Testable Hypothesis
The reason posts like these generate engagement but rarely produce durable strategies is that they're observational, not statistical. A single clean chart example proves the pattern exists on that day — it says nothing about its frequency, consistency, or risk profile across months or years of data.
To convert this Tuesday pre-New York gold observation into something you can actually evaluate, you need to formalize it into explicit, mechanical rules:
- Define the exact time window. "Before New York session" is vague. Pin it down — for example, the 60 or 90 minutes preceding the New York equities/futures open, expressed in a fixed broker-server or UTC time, adjusted for daylight saving transitions.
- Define the entry trigger. Is it a breakout of the London-morning range? A pullback to a specific moving average? A reaction at a prior day's level? Vague "setups" need to become IF/THEN logic before they can be backtested or coded into an EA.
- Define the exit logic. Fixed pip target, ATR-based stop, session-close exit, or a trailing mechanism — each produces materially different equity curves even with an identical entry.
- Isolate the day-of-week variable. Run the identical rule set across all weekdays, not just Tuesdays, so you can see whether Tuesday genuinely outperforms or whether the pattern is just recency bias from a handful of recent trades.
This is the difference between "I noticed something" and "I have a framework." Only the latter is worth risking capital — demo or otherwise — on.
Backtesting the Setup Properly
Once the rules are explicit, the next step is sourcing clean historical data and running the logic across a statistically meaningful sample. A few principles matter more than most retail traders assume:
Sample size and market regime coverage. Gold has moved through very different volatility regimes — the low-rate era, the 2022–2023 rate-hiking cycle, and more recent geopolitically-driven moves. A setup that only looks good over the last three months of data tells you almost nothing about its robustness. Test across at least several years, and explicitly separate results by volatility regime where possible.
Spread and slippage realism. XAUUSD spreads widen meaningfully around major news and at session transitions — precisely the window this setup targets. A backtest that ignores realistic spread and slippage assumptions around the New York open will systematically overstate performance. If you're building or refining an EA around this idea, make sure your testing environment models variable spread, not a static average.
Sample independence. Because you're isolating a single weekday, your effective sample size shrinks by roughly 80% compared to an all-days strategy. Fifty Tuesdays over a year is not a large sample in statistical terms — treat any edge found here with proportionally more skepticism and demand a longer lookback before drawing conclusions.
Out-of-sample validation. Split your data. Find the pattern on one segment, then verify it holds on data the optimization never touched. A Tuesday effect that appears in 2021–2023 but vanishes in 2024–2026 is a historical curiosity, not a trading framework.
For traders who want to run this kind of analysis rigorously, having clean, tick-level historical price data is the non-negotiable starting point — inconsistent or gap-filled data will produce misleading conclusions about session-based patterns before you've even gotten to strategy logic. BacktestMarket's forex historical data listings are built specifically for this kind of granular, session-level backtesting work, and pairing that data with a historical data pack covering multiple years lets you test the day-of-week question properly rather than eyeballing a chart.
Turning a Validated Pattern Into a Mechanical Process
Assume the backtest holds up: Tuesday's pre-New York window on XAUUSD does show a statistically meaningful, regime-stable behavioral tendency once realistic costs are applied. What next?
The natural progression is to remove discretionary judgment from the execution. Manually watching the clock every Tuesday to catch a 60–90 minute window is exactly the kind of repetitive, time-sensitive task that's prone to hesitation, missed entries, or emotional override — the same inconsistency that makes discretionary trading hard to evaluate in the first place. Encoding the validated rule set into an Expert Advisor for MT4 or MT5 lets you execute the exact logic you tested, at the exact time window you tested, without the discretionary drift that erodes edge in live markets.
If you're building this yourself, a few practical notes:
- Use server-time-based session filters rather than local time, and account for the fact that MT4/MT5 server time may shift with daylight saving independently of your local New York reference.
- Log every trade with timestamp, spread-at-entry, and slippage so you can compare live execution against your backtest assumptions over time — divergence here is an early warning that the edge is decaying or that broker conditions have changed.
- Re-validate quarterly. Session-based patterns tied to macro data clustering can shift if central bank calendars or data release schedules change.
If you're importing external tick data to build or refine this kind of session-specific model, our MetaTrader data import guide walks through the process step by step, and there's a parallel NinjaTrader import guide for traders working across platforms.
The Takeaway
A "clean setup" screenshot is a starting point for a hypothesis, not evidence of an edge. The Tuesday pre-New York XAUUSD pattern has a plausible structural rationale — liquidity transition, macro data clustering, and post-Monday normalization — but plausibility only becomes usable once it's converted into explicit rules, tested across multiple volatility regimes with realistic spread assumptions, and validated out-of-sample.
If you're intrigued by this pattern, don't trade it on observation alone. Pull several years of XAUUSD data, formalize the entry and exit logic, isolate the day-of-week variable against all other weekdays, and let the numbers — not the engagement count on a social post — decide whether it belongs in your systematic toolkit.