

The minimal reproducible pipeline for intraday data runs parse, validate, regularize or sample, detect and cap or flag, adjust for rolls and corporate actions, then version every output. Two techniques anchor this workflow: signature plots to pick a sampling frequency, and robust rolling-median or MAD capping to catch phantom spikes without destroying real volatility. For teams that want to skip the collection burden, vendor-supplied minute bars, such as the datasets from BacktestMarket, can shortcut raw ingestion while you still run your own validation suite.
TL;DR:
- Choosing the appropriate sampling frequency should be based on signature plots that identify where microstructure noise dominates, with foreign exchange tolerating seconds and bonds requiring minutes.
- Detecting phantom spikes involves checking for bars with abnormally long wicks, quick reversion, and low volume, and should be flagged rather than deleted to preserve grid integrity.
- Handling stale or missing bars requires session-based detection, with strategies like dropping gaps for research or bounded forward-filling for indicators, avoiding automatic gap bridging.
- Always run validation checks on vendor-provided data, including verifying timestamps, OHLC invariants, and session calendar consistency, and keep original files unaltered.
- Document and record all adjustments such as rolls, corporate actions, and data corrections with flags and ratios to ensure transparency and reproducibility in backtesting.
Table of Contents
- Parsing, timestamps, and session calendars
- Choosing a sampling frequency without fighting microstructure noise
- Catching phantom spikes, bad ticks, and outliers without erasing real moves
- Handling stale bars and missing bars without leaking information
- Corporate actions and futures rollover: keeping both raw and adjusted series
- Building a low-maintenance automated validation framework
- A practical checklist and lightweight ingest tests
- How vendor minute-bar data fits this workflow
- Conservative defaults and the risk nobody budgets for
- BacktestMarket: where clean, ready-to-import intraday datasets fit your pipeline
- FAQ
- Sources
Parsing, timestamps, and session calendars
Most downstream data problems start at parsing. Store every timestamp in UTC on disk, and keep exchange-local time only as a display or session-tagging attribute; mixing the two inside a single column is a common source of silent timezone bugs that only surface months later during a backtest reconciliation.
Early-close days and partial sessions need explicit handling rather than implicit trust in vendor timestamps. Cross-check suspected early closes against a holiday calendar and a peer series for the same instrument before trusting a short session as genuine.
A few recurring issues deserve a dedicated check each ingest run:
- Daylight saving transitions shifting bar boundaries by an hour in one region but not another.
- Clock drift between exchange feeds and vendor collection servers, producing timestamps a few seconds off.
- Provider labeling mismatches, where "bar close" sometimes means open time plus one interval and sometimes means something else entirely.
A canonical schema with explicit column names for open, high, low, close, volume, and a source_tz field removes most of this ambiguity before it reaches analysis code.
Choosing a sampling frequency without fighting microstructure noise
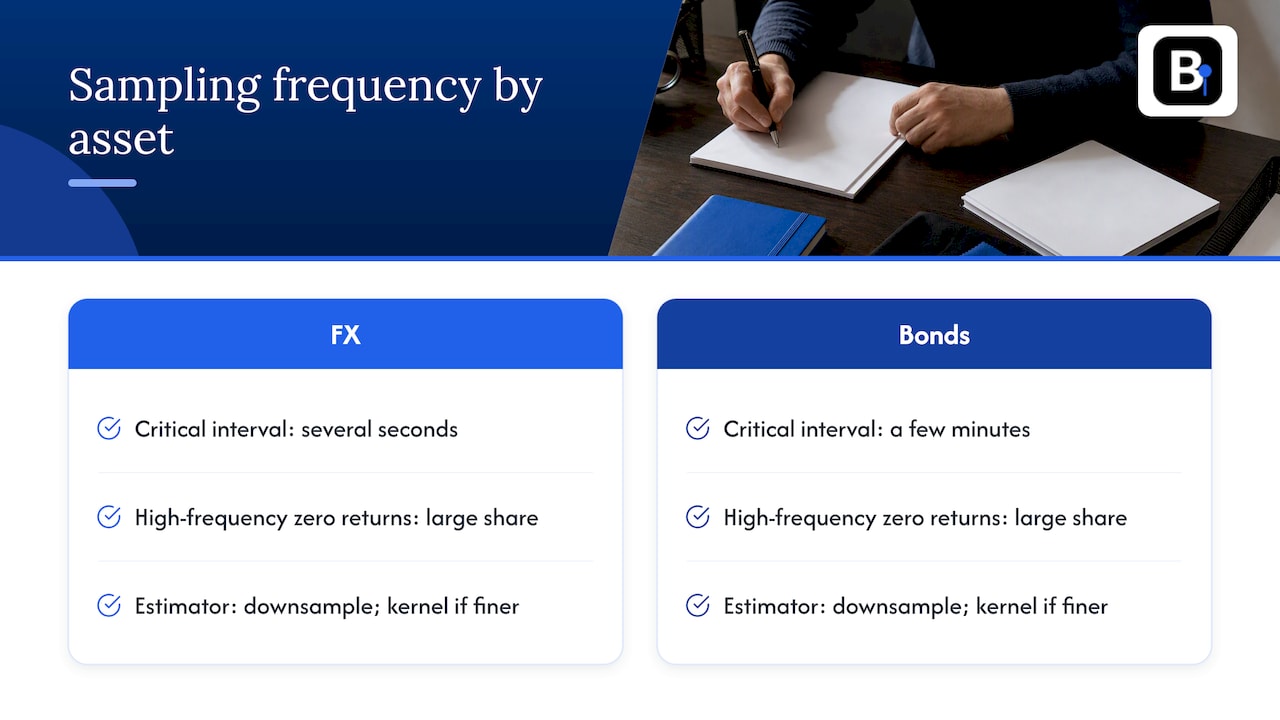
Signature plots remain the most practical tool for choosing a sampling interval: they show how estimated realized volatility changes as you vary the sampling frequency, and the point where the curve flattens is roughly where microstructure noise stops dominating. BIS research finds that critical sampling frequency differs by asset class, with foreign exchange tolerating intervals as fine as several seconds and bonds generally requiring intervals of a few minutes before the bias from noise becomes manageable.
The practical rule is to use the coarsest grid that still preserves the signal your strategy depends on, then confirm with a sensitivity test across a few neighboring frequencies rather than trusting one chosen interval blindly. At very high frequencies the same BIS data shows a large share of returns are exactly zero, which distorts volatility estimates and argues for coarser sampling or a kernel correction.
Realized-kernel and subsampling estimators earn their complexity when you need volatility estimates at frequencies finer than the signature-plot threshold; for most signal research, simple downsampling to the coarser grid is enough.
Catching phantom spikes, bad ticks, and outliers without erasing real moves
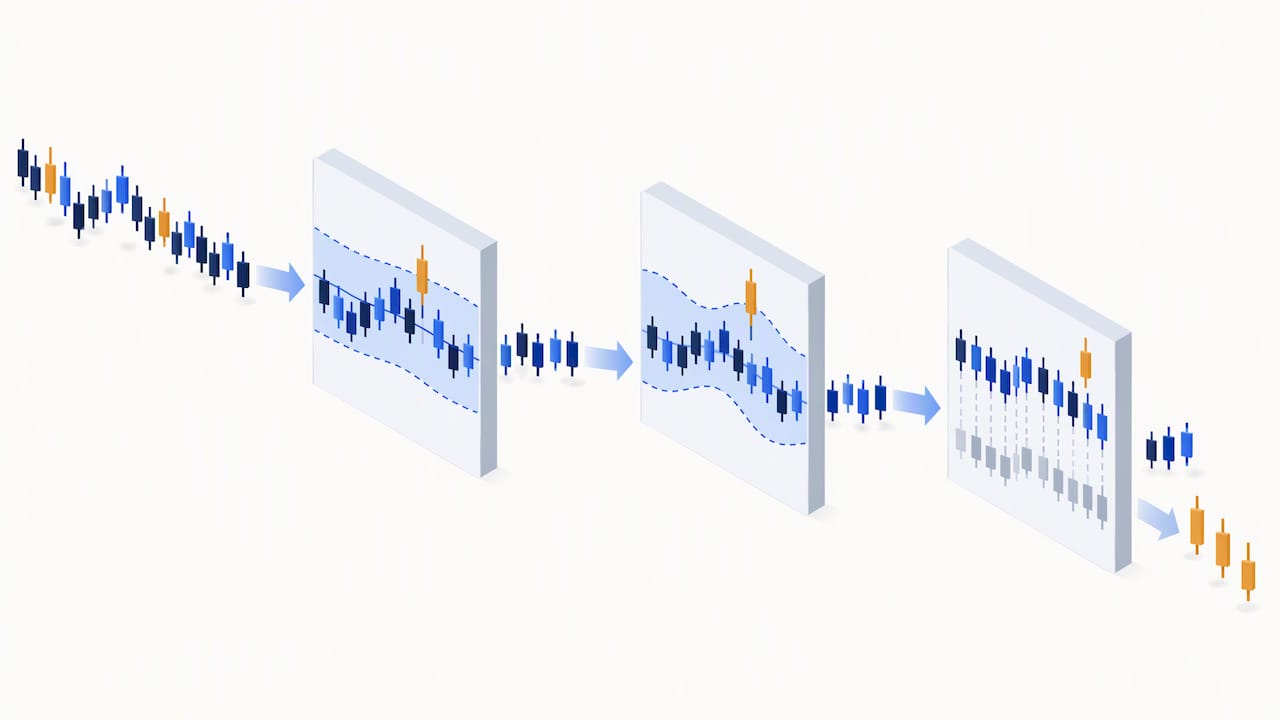
Phantom spikes, those single-tick wicks that vanish on the next bar, are reproducible enough to catch with a rule rather than a judgment call. A three-condition test works well in practice:
- The wick extends several times beyond the bar's own median wick size over a trailing window.
- The move reverts within one or two bars, leaving no persistent price level at the spike.
- Volume during the spiking bar is low relative to surrounding bars, suggesting a single stale or erroneous print rather than genuine trading interest.
When all three conditions hold, cap or reconstruct the bar rather than deleting it, and mark it with an explicit reconstructed flag while preserving the original raw value in a parallel column. Deletion breaks the regular grid and complicates any later join against other series.
Robust detectors matter here. A rolling median with median absolute deviation (MAD) scales naturally with local volatility, while a plain mean and standard deviation z-score test badly misfires on intraday returns, which are leptokurtic and produce false positives during genuinely volatile periods. Volatility-normalized thresholds, where the cap scales with recent realized variance rather than a fixed number of ticks, keep the filter conservative across both calm and turbulent regimes, an approach consistent with the standardization-before-filtering method described in research on cleaning high-frequency foreign exchange data.
Pro Tip: Run your phantom-spike detector on a known-clean reference series first; if it flags more than a handful of bars, your thresholds are too tight.
Handling stale bars and missing bars without leaking information
Stale bars, where the same close repeats for several periods with no trading activity, and outright missing bars both need detection against an expected grid per trading session rather than a flat calendar guess. Compute missingness as the ratio of observed bars to expected bars within each session window, since a thin pre-market session will naturally look sparser than the open.
The choice of fill policy depends heavily on what the data feeds into:
- For strict research and signal discovery, drop gaps rather than fill them, since any fabricated value can bias a backtest in ways that are hard to detect later.
- For indicators that tolerate a short lag, a bounded forward-fill, capped at a small number of bars, is reasonable.
- For interpolation or model-based imputation, only use it with an accompanying uncertainty column and a clear audit flag marking the value as synthetic.
Never forward-fill returns or labels directly, since that silently injects zero-variance periods into training data. Keep a gap-aware mask alongside any filled series so downstream code can exclude filled regions on demand, and mask fills across unusually large gaps rather than bridging them automatically. Our guide to recovering missing MT4 data walks through a concrete repair workflow for this exact problem.
Corporate actions and futures rollover: keeping both raw and adjusted series
Back-adjustment for futures and split or dividend adjustment for equities both solve the same problem: without them, a long-run backtest sees artificial jumps at every roll or corporate event that have nothing to do with market behavior. But strategy validation genuinely needs both versions, since the raw series is what volatility and risk calculations should reference, while the adjusted series is what a continuous-contract backtest should trade against.
Document the adjustment itself as data, not just apply it silently:
- Store a
roll_flagmarking exactly which bars were adjusted. - Record an
adjustment_ratioso the transformation is reversible. - Note the roll rule in plain text, whether it is volume-based, open-interest-based, or a fixed calendar date.
Keeping the raw series available for volatility verification, alongside the adjusted series for backtesting, prevents a whole class of hidden bias that only surfaces when someone tries to reconcile two versions of the same contract months later.
Building a low-maintenance automated validation framework
A small set of automated checks catches the overwhelming majority of real-world data problems without manual review of every bar, as outlined in our earnings quality analysis for analysts which includes practical checks and scopes for validation. The core checks worth running on every ingest are:
- Duplicate timestamps and strictly non-monotonic sequences within a session.
- OHLC invariants, confirming high is the maximum and low is the minimum of the bar's open, high, low, and close.
- Realistic range checks against recent historical volatility for the instrument.
- Max-gap alarms that fire when the time since the last valid bar exceeds a threshold.
- Holiday and session checks cross-referenced against the exchange calendar.
Cross-validating against a peer series or an independent reference feed catches coverage problems a single-source check cannot see on its own. Machine learning classifiers, where used, work best as a triage layer that flags suspicious bars for human review rather than one that silently repairs data on its own, a distinction echoed in BIS work on machine learning validation workflows for financial time series.
Pro Tip: Emit a daily quality report with each metric plus the git hash of the pipeline code that produced it, so any later discrepancy can be traced to an exact code version.
A practical checklist and lightweight ingest tests
A short, repeatable checklist keeps a cleaning pipeline auditable rather than ad hoc: parse, normalize, run ingest tests, regularize the grid, flag or cap anomalies, adjust for rolls and corporate actions, then version and report.
A handful of metrics recorded at every run make the pipeline's output trustworthy months later:
missing_rateandstale_count, showing how much of the expected grid was actually observed.capped_countandphantom_count, showing how aggressively the detectors intervened.vendor_idandpipeline_git_hash, tying every output file back to its exact source and code version.
| Metric | What it measures | Why it matters |
|---|---|---|
| missing_rate | Share of expected bars absent from the grid | Flags coverage gaps before backtesting |
| capped_count | Bars adjusted by the outlier detector | Shows how much the filter altered the data |
| phantom_count | Bars matching the three-condition spike rule | Separates real moves from bad ticks |
| pipeline_git_hash | Code version that produced the output | Makes results reproducible and auditable |
A lightweight ingest test, run as a CI step, just needs to assert that timestamps are strictly increasing, that OHLC invariants hold on every row, and that the missing rate stays under a set threshold for the session, failing loudly rather than silently passing bad data downstream.
How vendor minute-bar data fits this workflow
Buying clean, ready-formatted minute bars does not remove the need for local validation, it changes what you spend your time on. BacktestMarket has offered clean minute-bar historical intraday data across forex, metals, bonds, and stock indices since 2014, formatted for direct import into MT4 and MT5, with support available directly from the engineers who assemble the datasets.
Even with a vetted vendor, run the same short validation suite described above on arrival, request provenance metadata covering roll methodology and session calendars, and keep the original vendor files untouched alongside any locally adjusted copies. Vendor data saves the collection and normalization work; roll audits and calendar checks for your specific instruments still belong to you.
Conservative defaults and the risk nobody budgets for
Our own bias runs conservative: flag before capping, cap before deleting, and always keep the raw column next to whatever correction you apply. The biggest operational risk we see is not a bad detector, it is accepting a third-party feed without running any verification pass at all, treating "vendor-provided" as a substitute for "checked."
— Start
BacktestMarket: where clean, ready-to-import intraday datasets fit your pipeline
We offer ready-to-import minute-bar datasets across various financial instruments, along with Expert Advisors and Indicators for traders building automated strategies. Our Historical Data catalog is built for direct MT4/MT5 import, and an Annual Plan at 119 EUR per year covers ongoing access for teams who update their backtests regularly.
Before buying from any vendor, including us, ask for the session calendar used, the roll methodology for any futures series, and a QA report covering gap rates and known corrections. Support is available directly for these questions. This is where a dataset purchase differs from scraping a feed yourself: the collection and normalization work is already done, and you spend your validation time checking the methodology instead of building a parser from scratch. Browse our stock indices data or the full product catalog to see what is available for your instruments.
FAQ
What is the minimal pipeline for cleaning intraday data?
A minimal, reproducible pipeline runs parse, validate, regularize or sample, detect and cap or flag anomalies, adjust for rolls and corporate actions, then version the output with a code hash. Each stage should log its own metrics, such as missing rate and capped count, so the pipeline stays auditable across runs.
How do I choose a sampling frequency for intraday data?
Signature plots are the standard tool: they chart how estimated volatility changes as sampling frequency varies, and the interval where the curve flattens is a reasonable starting point. BIS research finds foreign exchange tolerates sampling intervals near fifteen to twenty seconds, while bonds typically require intervals of a few minutes before microstructure noise becomes manageable.
Should I delete or cap detected outliers and phantom spikes?
Cap or reconstruct flagged bars rather than deleting them, and mark the correction with an explicit flag while preserving the original raw value in a separate column. Deletion breaks the regular time grid and complicates later joins against other series or vendors.
How should I handle missing or stale intraday bars?
Detect them against the expected bar count for each trading session, then choose a fill policy based on use: drop gaps for strict research, use a bounded forward-fill for indicators, and reserve interpolation for cases with an explicit uncertainty flag. Never forward-fill returns or labels directly, since that can inject artificial zero-variance periods into a backtest.
Does buying vendor data remove the need for my own validation?
No. Vendor data removes the collection and normalization burden, but running a short validation suite on arrival, checking provenance metadata, and keeping the original files untouched remain the buyer's responsibility.
Sources
Recommended
- Nasdaq Intraday Data: Access, Specs, and Practical Use
- Minute Bar Data: What Quants Need for Reliable Backtests
- 5 Audits Quants Must Run on Outlier Handled M1 Data Before MT4/MT5
- Audit First MT5 Backtesting Data: Gap, Timestamp, Ready to Import
Related resources
Explore BacktestMarket's Expert Advisor robots to put the ideas in this article into practice.