

Out-of-sample testing means judging a trading strategy on data it never saw while you were building and tuning it. You develop on one slice of history (in-sample), lock the rules, then run them once on a untouched slice (out-of-sample). If performance holds up, the edge may be real. If it collapses, you probably fitted noise.
This guide covers how to split your data, how much to hold out, why a single holdout is weaker than most traders think, and how to run the test on minute-bar data in MT4 or MT5.
TL;DR
- In-sample data is where you design and optimize. Out-of-sample data is where you check, once, with the rules frozen.
- A common starting split is 80% to develop and 20% to test, but for time series the holdout must be the most recent period, never a random shuffle.
- Every extra configuration you try raises the odds of a false winner. Count your trials and treat the out-of-sample result as spent once you have looked at it.
- Rolling or walk-forward tests across several periods are more reliable than one fixed holdout.
- The test is only as honest as the price data underneath it. Gaps, bad ticks and unadjusted rolls will corrupt both halves.
Table of Contents
- What out-of-sample testing actually measures
- In-sample vs. out-of-sample: the practical difference
- Why the in-sample result misleads you
- How to split your data
- Why one holdout is not enough
- A workflow that holds up
- Reading the results
- Bad data ruins both halves
- Our perspective: what we see when traders test
- Running the split on clean minute-bar data
- Common mistakes to avoid
- FAQ
- Sources
What out-of-sample testing actually measures
The idea comes from statistics: a model should be judged on data it was not built from. Cross-validation methods), sometimes called out-of-sample testing, exist to estimate how a result will generalize to an independent dataset. The Eurostat glossary describes the same split for forecasting: an in-sample period is used for the initial parameter estimation and model selection, and the remaining period is used to test the forecast.
For a trader, that translates into two numbers for the same strategy:
- In-sample result: how the rules performed on the data you used to pick the entry logic, the indicator periods, the stops and the filters.
- Out-of-sample result: how the identical rules performed on data that played no part in those choices.
The in-sample number is flattering by construction. Lecture notes from Stanford describe the goal of validation as an honest simulation of how a model behaves on unseen data. The same notes make a useful point: some drop from training to test performance is normal and not a failure in itself. The warning sign is a model that looks nearly perfect on the data it learned from and falls apart on new data.
In-sample vs. out-of-sample: the practical difference
| In-sample | Out-of-sample | |
|---|---|---|
| Purpose | Build and optimize the strategy | Verify it on unseen data |
| How often you may look | As often as you like | Once per candidate, ideally |
| What you may change | Rules, parameters, filters | Nothing |
| Typical weakness | Captures noise as well as signal | Shrinks once you peek and re-tune |
| What a good result means | The idea is worth testing | The idea may survive new conditions |
The row that matters most is the third one. The moment you adjust a rule because of what the out-of-sample run showed, that data has become in-sample. It is the most common way traders fool themselves, and it is easy to do without noticing.
Why the in-sample result misleads you
A strategy with several free parameters can bend to fit almost any price history. The statistics literature is blunt about this: in-sample error typically understates) the true forecasting error, because the model captures random noise along with genuine signal.
How quickly this happens is the part many traders underestimate. Bailey and Lopez de Prado show that after testing only 7 strategy configurations, a researcher can expect to find a 2-year backtest with an annualized Sharpe ratio above 1, even when the true out-of-sample Sharpe ratio is zero. Seven. That is one afternoon of tweaking a moving-average length and a stop distance.
A related paper by Bailey, Borwein, Lopez de Prado and Zhu argues that high simulated performance is easily achievable after backtesting a relatively small number of alternative configurations, a practice they call backtest overfitting. They also note that the number of trials is the most critical figure for judging a backtest, yet it is rarely reported.
The practical lesson: keep a log of every variant you test. If you cannot say how many you tried, you cannot say how much to trust the winner.
How to split your data
There is no universal ratio, but there are sensible defaults and firm rules.
The 80/20 starting point
Standard holdout validation often uses about 80% of the data for training and 20% for testing. For a strategy built on minute bars from 2014 onward, that would mean developing on roughly the first eight or nine years and testing on the final two or three. Treat the ratio as a starting point. What matters is that the test window is long enough to contain a meaningful number of trades and more than one market mood.
Keep time order
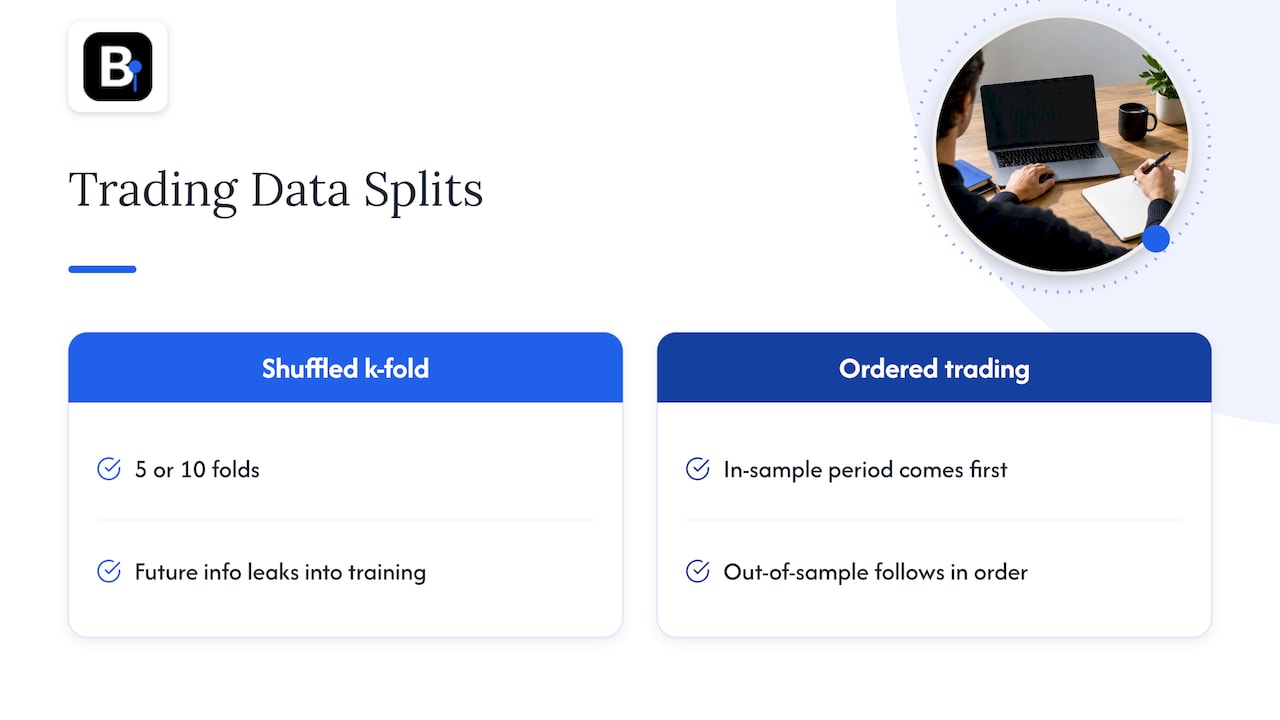
Random k-fold splits are common in machine learning, and the same source notes that k-fold cross-validation usually uses 5 or 10 folds. Be careful porting that to price series. Shuffling bars lets information from the future leak into training, because adjacent bars are correlated and many strategies hold positions across them. For trading, the out-of-sample period should come after the in-sample period, in order.
Check that the holdout is different enough
A two-year holdout that sits entirely in a calm trending market tells you little about how the rules behave in a volatility spike. Before you trust the result, look at what the test window contained: trending and ranging stretches, at least one sharp drawdown in the instrument, and a spread of volatility levels. If it contained none of those, widen it or add a second window.
Decide the rules before you run
Write down, before the test, what counts as a pass. Examples: out-of-sample profit factor stays above a set floor, maximum drawdown does not exceed what you were willing to accept in-sample by more than a stated margin, and trade count is large enough to mean something. Rules set after seeing the result are rationalizations.
Why one holdout is not enough
A single fixed split gives you one draw from a very noisy process. Lopez de Prado and colleagues argue that trying many configurations until a result looks good makes standard techniques such as a single hold-out set unreliable. If you tune on in-sample, look at the holdout, tweak, and look again, you have effectively optimized on the holdout too.
There is a second problem: one test period can be unrepresentative. A review of forecast evaluation by Tashman recommends rolling-origin evaluations and multiple test periods rather than one fixed split, because that reduces sensitivity to particular business-cycle phases and special events.
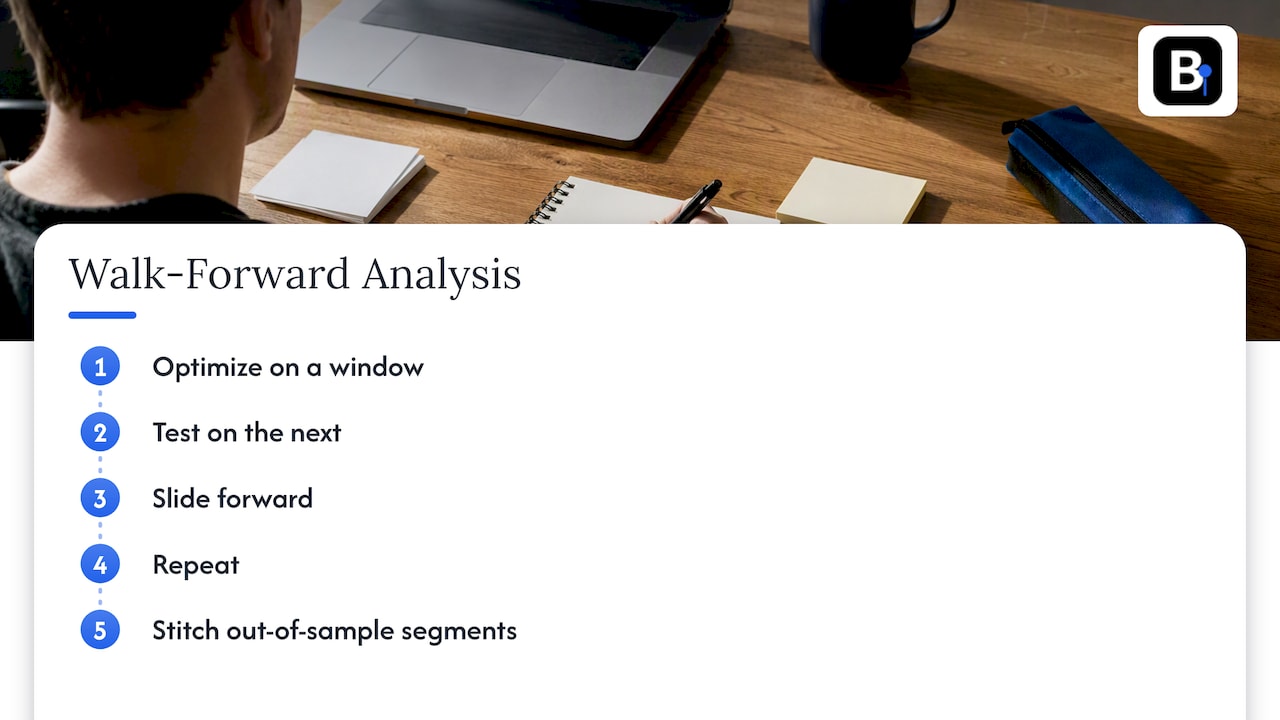
For trading systems, the usual answer is walk-forward analysis: optimize on a window, test on the next, slide forward, repeat, and stitch the out-of-sample segments into one equity curve. We explain the mechanics and the common mistakes in our post on walk-forward analysis and good backtesting practices.
A workflow that holds up
- Fix the data first. Audit the price history before any test. Our 7-step data audit walks through gaps, outliers and timestamp problems.
- Reserve the holdout. Cut off the most recent block of data before you open a chart. Do not look at it.
- Develop in-sample. Build the idea, with as few free parameters as the logic allows. Log every variant you try.
- Stress the parameters. Check that nearby parameter values perform similarly. A single sharp peak surrounded by losses is a fit, not an edge. Our guide to managing overfitting in trading systems covers this in more detail.
- Freeze the rules. Write them down with exact parameters, costs and position sizing.
- Run the out-of-sample test once. Record the result, pass or fail, against your pre-set criteria.
- Repeat across windows. Use walk-forward or several rolling windows to see whether the result is stable.
- Go forward on a demo or small size. Live data after your last data point is the only truly clean out-of-sample.
Reading the results
Expect the out-of-sample numbers to be worse than the in-sample ones. The question is by how much, and in what way.
- Modest decay, same shape: returns lower, drawdowns somewhat deeper, trade frequency similar. That is typical of a real but imperfect edge.
- Collapse: profit factor near 1 or below, or an equity curve that turns flat or negative at the split. That points to overfitting.
- Out-of-sample better than in-sample: do not celebrate. Check for a lucky window, a different volatility regime, or too few trades.
On which metrics to look at, a study of 888 algorithmic strategies by Wiecki and colleagues found that backtest Sharpe ratio had negligible predictive power for live results, with an R² below 0.025. The same paper found that strategies subjected to more extensive backtesting showed larger gaps between backtest and out-of-sample results. Their suggestion is to pay more attention to volatility, maximum drawdown and portfolio features such as hedging than to the headline Sharpe ratio. Treat that as a reason to read the whole report, not just one ratio.
Bad data ruins both halves
Out-of-sample testing assumes the history is a faithful record. If it is not, the test can fail for the wrong reason, or pass for the wrong reason.
Typical problems for minute-bar work:
- Missing bars and gaps that change when indicators warm up and how stops get filled.
- Spikes and bad ticks that trigger phantom stop-outs or phantom winners.
- Inconsistent history between the two periods, for example a feed that changed its quoting or session times partway through.
- Unadjusted futures rolls that put artificial jumps into a continuous series. See our explanation of rolling rules for futures contracts.
If the in-sample half comes from one source and the out-of-sample half from another, differences in the data alone can look like a strategy failure. Use one consistent, documented dataset across the full span.
Our perspective: what we see when traders test
We supply minute-bar history and talk to the people who use it, so we see the same patterns repeatedly. Most failed validations are not caused by the out-of-sample method. They come from three upstream habits.
First, traders run the holdout too early. They peek during development, and the holdout quietly turns into a second in-sample set. Cut it off at the start and treat it as spent after one look.
Second, they trust a backtest before checking the data. A strategy that appears to fail out-of-sample is sometimes failing on a gap, a bad roll or a timestamp shift. That is why we verify our datasets bar by bar and document adjustments: you should be able to rule out the data before you rule out the idea.
Third, they test on a single symbol and single period and call it done. Even a clean pass deserves a second look on other windows and, where the logic allows, other instruments. Our posts on multi-symbol backtesting and portfolio backtesting in MT4 show how to do that without fooling yourself about drawdown.
If you want a worked MetaTrader sequence for the in-sample, walk-forward, out-of-sample progression, see our article on MT5 backtesting data. For the tester basics, read how to backtest an Expert Advisor in MetaTrader 4.
— Start
Running the split on clean minute-bar data
A practical setup for MT4 or MT5:
- Import one continuous minute-bar history covering the full period, so the in-sample and out-of-sample halves share the same source and conventions.
- Set the tester date range to the in-sample window for development and optimization.
- Save the exact settings file for the frozen version.
- Change only the date range to the holdout window and run once, with the same spread, commission and lot sizing assumptions.
- Export the trade list and compare trade count, average trade, drawdown and equity shape between the two runs.
Our Historical Data page lists the minute-bar datasets we offer, which run from 2014 and import directly into MT4 and MT5. If you want to test across several markets, the Annual Plan is €119 per year. Questions about which dataset fits your split go to our engineers, who collect the data and answer support requests directly.
Common mistakes to avoid
- Re-optimizing after a bad holdout. If you adjust parameters and test the same holdout again, it is no longer out-of-sample.
- Ignoring costs. Spreads, commissions and slippage often decide whether a thin edge survives. Apply the same realistic costs in both halves.
- Too few trades. A holdout with a few dozen trades cannot separate skill from luck.
- Testing only the winner. Report how many variants you tried. A winner picked from hundreds is less credible than one from a handful.
- Using the holdout for model selection across many strategies. Choosing the best of twenty candidates by their holdout results repeats the overfitting problem one level up.
- Treating a pass as proof. Out-of-sample success lowers the risk of a fitted result. It does not remove it, and past performance never guarantees future returns.
FAQ
What is the difference between in-sample and out-of-sample testing?
In-sample testing measures performance on the data used to build and tune the strategy. Out-of-sample testing measures the same frozen rules on data that played no part in those decisions. The first tells you whether an idea is worth pursuing, the second whether it generalizes.
How much data should I hold out?
A common starting point is about 20% of the history, taken from the most recent period. The better test is whether the window is long enough to hold many trades and several market conditions. If it is not, use walk-forward testing with several windows instead of one large block.
Is out-of-sample validation the same as walk-forward analysis?
Not quite. A holdout is one split. Walk-forward analysis repeats the optimize-then-test cycle across rolling windows, so you get many out-of-sample segments instead of one. It is generally the more reliable of the two for trading systems.
Can I reuse the out-of-sample data after seeing the result?
Only as in-sample data. Once you have changed anything because of what the holdout showed, it has influenced the strategy and can no longer give an honest verdict. Reserve a fresh period, or forward-test on live data after your last bar.
Sources
- Cross-validation (statistics), Wikipedia)
- In-sample vs. out-of-sample forecasts, Eurostat Statistics Explained
- Validation, Stanford EE104 lecture notes
- Model Validation, Introduction to Statistical Modeling
- What to Look for in a Backtest, Lopez de Prado, SSRN
- Pseudo-Mathematics and Financial Charlatanism, Bailey, Borwein, Lopez de Prado, Zhu, SSRN
- All that Glitters Is Not Gold, Wiecki et al., SSRN
- Out-of-sample tests of forecasting accuracy: an analysis and review, ScienceDirect
Recommended
- MT4 Portfolio Backtesting: Export Replay to Find Real Drawdowns
- Run This 7 Step Data Audit Before Backtesting on MT4/MT5
- Stop Fake Alpha: 5 Checks Quants Need for Hedging Backtesting Data
- 99% Modeling Quality for Quants: MT5 Backtesting Data IS to WFA to OOS
Related resources
Explore BacktestMarket's Expert Advisor robots to put the ideas in this article into practice.