

Ignoring transaction costs typically flips a strategy's live viability. Commissions, spread, and slippage can erase the edge of a high-turnover strategy entirely, so the fix is to build a defensible cost model using implementation shortfall and market impact parameters, then test it across at least three regimes: zero, baseline, and heavy cost. Engine choice and data quality quietly add their own layer of risk on top of that.
TL;DR:
- Convert broker, exchange, and clearing fees into basis points of average trade notional, then add quoted spread and impact that rises with order size separately.
- Estimate spreads from quotes when available, and model larger orders with square root impact based on order size relative to average daily volume.
- Test zero, baseline, double baseline, and heavy cost regimes, recording implementation shortfall and market impact; rework strategies whose baseline net returns miss your threshold.
- Engines that match at zero cost can diverge by up to 3.7% of total return under heavy costs, so cross check fills and fees independently.
- Audit gaps, timestamp alignment, and tick integrity before estimating costs, then document the data source, date range, and adjustments so another reviewer can reproduce results.
Table of Contents
- Which transaction costs matter and how they behave
- How to model transaction costs in backtests (practical models and formulas)
- Implementation risk: why different engines and implementations give different results
- A practical workflow: add defensible transaction costs to your next backtest
- How clean minute-bar data changes cost realism
- Balancing academic realism and implementable backtests
- How BacktestMarket data can help you simulate realistic transaction costs
- FAQ
- Sources
Which transaction costs matter and how they behave
Three cost categories drive most of the gap between a paper strategy and a live one: commissions, spread, and slippage or market impact.
Commissions are the easiest to model because they are contractual. Brokers quote fixed fees per trade, variable fees per share or per lot, or minimum ticket charges. Converting any of these into a per-trade basis points figure makes them comparable across instruments and position sizes, and that conversion should happen before the cost model touches anything else.
Bid-ask spread is a realized round-trip cost: you buy at the ask and sell at the bid, and that gap is paid on every entry and exit regardless of how the trade performs. Spread widens sharply in illiquid instruments and during volatile sessions, so a static spread assumption understates cost in exactly the conditions where a strategy is most likely to misfire.
Slippage and market impact are related but distinct. Slippage is the difference between the price you expected and the price you got. Market impact is the price movement your own order causes, which matters more as size grows relative to available liquidity. Implementation shortfall (IS) captures the full difference between a benchmark or model price and the actual traded price, including opportunity cost from delayed fills, while market impact (MI) isolates the arrival-to-traded price gap caused by the order itself.
Turnover amplifies all three costs because every rebalance pays them again.
- A strategy that trades its full book twenty times a year pays its round-trip cost twenty times, not once.
- Doubling turnover without widening the edge roughly doubles annual cost drag.
- Low-turnover strategies with thin edges can survive costs that would sink a high-frequency variant of the same signal.
How to model transaction costs in backtests (practical models and formulas)
Three model types cover most backtesting needs, in increasing order of complexity.
- Proportional (bps) model: charge a fixed number of basis points per trade, scaled by notional. Code-friendly form:
cost = notional * (bps / 10000), applied on both entry and exit. - Spread-based model: estimate the round-trip spread directly from minute bars, using the average high-low range or quoted bid-ask when available, and apply half the spread to each fill.
- Slippage and impact models: for larger orders, a square-root impact formula,
impact = sigma * sqrt(order_size / average_daily_volume), scales more realistically than a flat bps charge because impact grows sublinearly with size. A linear approximation works for small, liquid orders. The Kyle lambda framing treats impact as a linear function of order flow relative to market depth, useful when you have a liquidity proxy but not a full volume curve.
Amortizing a one-time cost across an expected holding period makes sense when a strategy holds positions for days or weeks and the entry cost is small relative to expected return over that horizon. It is a poor fit for strategies with uncertain or highly variable holding periods, where the amortized figure can mask a position that gets closed out far earlier than planned.
Mapping real fee schedules into these parameters takes some arithmetic: broker commissions convert to bps by dividing the flat or per-share fee by average trade notional, exchange fees and clearing costs add on top as their own line item, and all three should be summed into a single effective bps figure before you run the backtest. A simple fill formula for minute-bar slippage is a practical starting point for traders who want to code this without building a full market impact model from scratch.
Pro Tip: Build your cost model as a separate, swappable module rather than hardcoding bps values into your strategy logic, so you can run regime comparisons without touching the strategy code itself.
Implementation risk: why different engines and implementations give different results
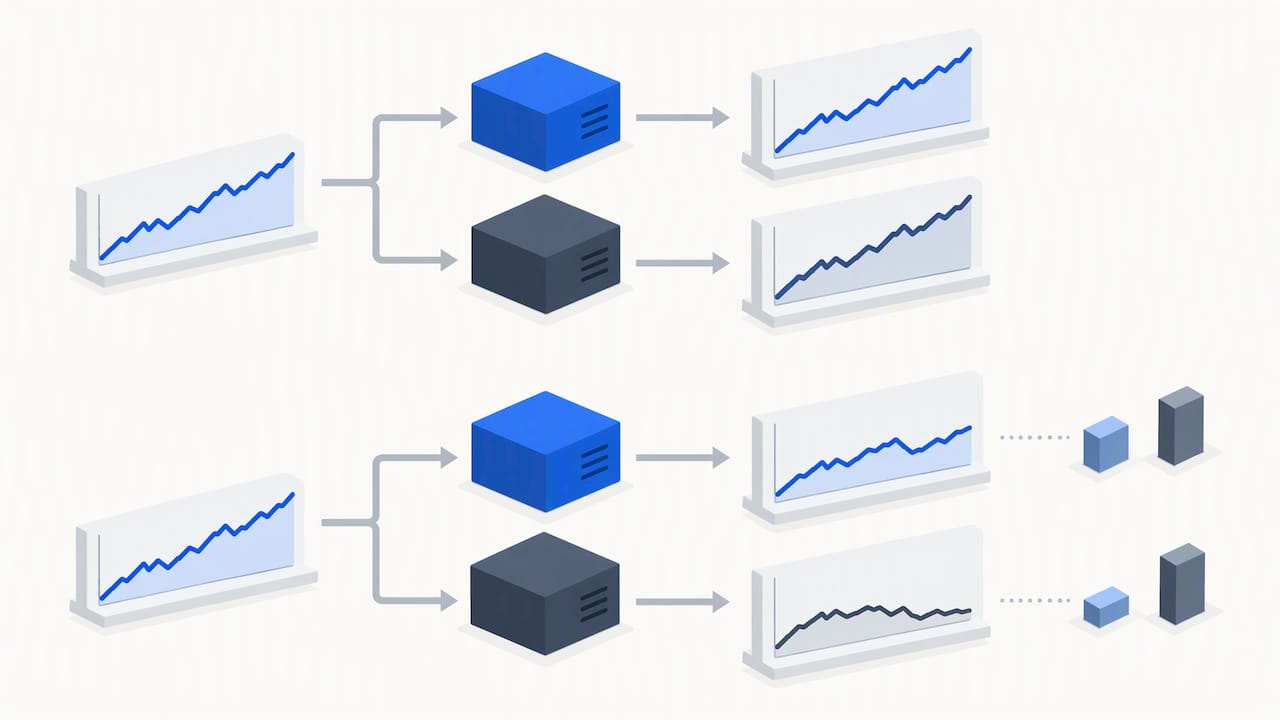
A backtest engine is not a neutral calculator. Two engines running the identical strategy and identical cost assumptions can produce materially different net returns, and the gap grows with cost intensity and turnover. This divergence has been labeled implementation risk, and it is large enough to matter for any strategy that trades frequently.
Common engine bugs worth checking before you trust a result:
- Commission unit errors, where a fee meant to be in dollars per share gets applied as dollars per trade or vice versa.
- Double-counting slippage, where both a spread cost and a separate slippage cost are applied to the same fill.
- Wrong notional basis, where position sizing uses stale price data instead of the fill price actually used for the cost calculation.
A short diagnostic checklist catches most of these: run a zero-cost baseline first and confirm it matches a hand-calculated expectation, then run the same strategy through a second engine or a simple reference implementation and compute the gap between the two as an engine spread.
Under heavy cost regimes, multi-engine benchmarking found return divergence of up to roughly 3.7% of total return between implementations that agreed exactly at zero cost. That gap is the implementation risk hiding inside a single-engine result. Reporting IS and MI alongside gross returns in every backtest output, rather than net return alone, makes that risk visible instead of buried.
A practical workflow: add defensible transaction costs to your next backtest
Building a credible cost model does not require a research detour. It fits into five steps inside an existing backtest cycle.
- Audit your data. Check for gaps, confirm correct time alignment across symbols, and verify spread and tick integrity before deciding whether minute bars or tick data suit your signal's holding period. A structured data audit before backtesting catches most of the errors that later look like cost-model bugs.
- Implement a baseline cost model. Pick starting parameters appropriate to the asset class and code them into the engine as a standalone module.
- Run four cost regimes. Zero cost, a baseline figure, double the baseline, and a heavy regime, capturing IS and MI at each step.
- Cross-check with a second engine. Run the same strategy and parameters through a reference implementation and record the engine spread between the two net-return outputs.
- Report sensitivity with a turnover-adjusted cost-intensity score, and apply a decision rule: if net returns fall below your threshold under the baseline regime, the strategy gets reworked or discarded before it reaches paper trading.
These regime levels follow the sensitivity ranges used in implementation risk research, where baseline, double, and heavy cost scenarios are the standard way to expose how fragile a strategy's edge really is. Traders working in MT4 or MT5 can pair this workflow with replay-based drawdown testing to confirm the cost-adjusted results hold up outside the original backtest window.
How clean minute-bar data changes cost realism
Spread and slippage estimates are only as good as the bars they come from. Gaps, misaligned timestamps, and noisy ticks bias both the estimated round-trip spread and the fills a backtest assumes, producing a cost model that looks precise but rests on bad inputs. A thin candle caused by a data gap can understate spread during exactly the volatile minute where real spread would have widened.
Clean, minute-bar intraday data removes that noise at the source.
- Comprehensive clean minute-bar intraday datasets are available across forex, metals, bonds, and stock indices going back to 2014.
- The all-in-one downloads are ready for immediate import into MT4 and MT5, with no reformatting step between purchase and backtest.
- Data is verified bar by bar and adjustments documented, so the dataset a cost model runs against has a traceable history.
- Customer support comes directly from the engineers who build and maintain the datasets, for questions that come up mid-project.
Documenting the source, date range, and any adjustments applied to the data you used is worth including in your own backtest output. It turns a cost-model result from a one-off number into something a second reviewer, or a second engine, can actually reproduce.
Balancing academic realism and implementable backtests
A perfect cost model that nobody can audit is worse than an approximate one that is fully documented. I would rather see a strategy tested with simple bps assumptions, clearly stated and sensitivity-tested across regimes, than one wrapped in an impact model so elaborate that nobody outside its author can validate it. Reproducibility and multi-engine checks against clean data do more for your confidence in a result than another decimal place of model sophistication.
— Start
How BacktestMarket data can help you simulate realistic transaction costs
Once your cost model is built, it is only as trustworthy as the bars feeding it. Clean minute-bar datasets across forex, metals, bonds, and stock indices, formatted for immediate import into MT4 and MT5, can support spread and slippage estimates based on fills that occurred rather than gaps software might interpolate around.

For FX-focused cost modeling, the Forex Major Full Pack covers the major pairs most traders backtest first, with the same bar-by-bar verification applied across the set. The Annual Plan runs €119 per year and gives ongoing access across our catalog for research cycles that run multiple strategies through multiple regimes over time.
- Start with the Historical Data page to explore available instruments and data formats.
- Check Expert Advisors and Indicators if your workflow needs tools built around the same datasets.
- Review the Forex Major Full Pack if FX is your primary backtesting focus.
If spread estimation on illiquid or cross-venue instruments is part of your process, the techniques in this prediction-market slippage guide are worth a look alongside your own data audit.
FAQ
What is transaction cost backtesting?
Transaction cost backtesting means adding commissions, spread, and slippage or market impact into a strategy's historical simulation instead of testing on frictionless prices. It typically involves modeling these costs as basis points per trade and running the strategy across multiple cost regimes to see how sensitive its returns are.
How much do transaction costs typically reduce returns?
The effect depends heavily on turnover and trade size. Live-trade data analyzed in the Frazzini, Israel, and Moskowitz study found a median market impact of about 7.98 basis points and a median implementation shortfall of about 10.34 basis points, with value-weighted figures considerably higher for larger trades.
Why do different backtest engines give different results with the same strategy?
Different engines handle fills, commission units, and notional calculations in different ways by default, and those differences compound as transaction cost intensity rises. This gap, known as implementation risk, can reach several percentage points of total return for high-turnover strategies even when both engines agree exactly at zero cost.
What's a reasonable baseline cost assumption to start with?
A commonly used baseline in sensitivity testing is a realistic per-trade cost assumption, with double and heavy regimes used to stress-test the strategy. The right starting figure still depends on instrument liquidity and your actual broker fee schedule, so treat these as a starting point rather than a universal number.
Does better historical data actually improve cost modeling?
Yes. Gaps and misaligned bars distort spread and slippage estimates, which feeds directly into an inaccurate cost model regardless of how sophisticated the formula is. Clean, verified minute-bar data removes that source of error before the cost model ever runs.
Sources
- Implementation Risk in Portfolio Backtesting: A Previously Unquantified Source of Error
- Trading Cost of Asset Pricing Anomalies (Frazzini, Israel, Moskowitz)
Related resources
Explore BacktestMarket's historical data packs to put the ideas in this article into practice.