

Prefer 1-minute bars when you are testing a microstructure-sensitive edge on a liquid instrument and you can model slippage and latency realistically. Prefer 5-minute bars when liquidity is thinner, transaction costs are uncertain, or your edge holds on a structural signal like VWAP or an EMA. The trade-off is always granularity against noise and cost, and either choice only means something once it survives walk-forward validation with a realistic execution model.
TL;DR:
- A signature plot of realized volatility across sampling intervals can expose bias near one minute; check zero return bars during your trading session.
- Five minute bars yield one fifth as many rows, while one minute bars add near duplicate observations that can raise overfitting risk.
- Model slippage against the instrument’s spread and order size, and apply commissions and financing costs to every simulated trade before judging net returns.
- Use walk forward validation with a fixed purge gap, expressed consistently in bars or trading days, and recalculate it when changing timeframes.
- A gold strategy using regime filters held up at five and fifteen minutes after costs, supporting structural rules over finely tuned thresholds.
Table of Contents
- Core Trade-Offs: Granularity, Microstructure Noise, and Compute Cost
- How Timeframe Choice Changes Backtest Metrics and Model Behavior
- Modeling Slippage, Latency, and Execution Realism for 1m vs 5m
- Step-by-Step Checklist to Choose and Validate Your Timeframe
- How Clean Minute-Bar Data Supports These Tests
- What Actually Matters When You Pick a Timeframe
- Get Clean Minute Bars and Start the Paired Test
- FAQ
- Sources
Core Trade-Offs: Granularity, Microstructure Noise, and Compute Cost
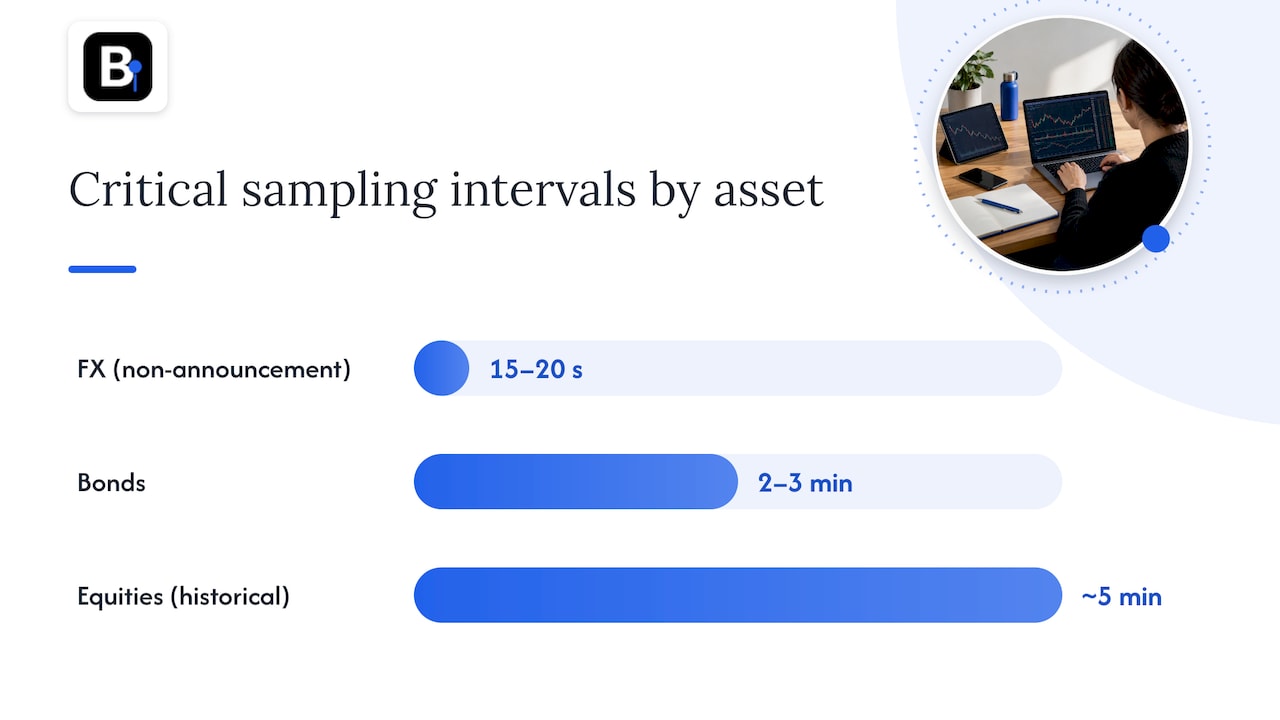
Shortening your sampling interval gives you more observations of price, but it does not give you proportionally more information. Realized-volatility estimates computed from very short intervals are biased upward by microstructure noise, bid-ask bounce, and discrete tick sizes. BIS research on sampling frequency shows the critical sampling interval, the point where this bias becomes material, can be as short as 15 to 20 seconds for FX on non-announcement days, while for bonds it stretches to 2 to 3 minutes. Historically, a coarser interval around 5 minutes was recommended for equities specifically to avoid this bias.
Microstructure noise dominates your signal when trade sizes are small relative to the quoted spread, when the instrument trades on multiple venues with price discovery lags, or when you are testing near session opens and closes where quote flickering is heaviest. One-minute bars sit closer to this noise floor than 5-minute bars, so a strategy that looks sharp at 1m can simply be trading noise.
There is also a practical cost. Five-minute data produces a fifth of the rows of 1-minute data, which cuts storage, memory, and feature-computation time for any walk-forward loop that retrains across hundreds of folds.
Quick checks before committing to 1-minute sampling:
- Confirm your instrument's typical spread is a small fraction of the average 1-minute price range.
- Check the fraction of 1-minute bars with zero or near-zero returns during your trading session.
- Confirm your execution venue publishes timestamps precise enough to match 1-minute bar boundaries.
Pro Tip: Run a signature plot of realized volatility against sampling interval before you pick a timeframe. A flat line across intervals means your edge is probably robust to this choice; a steep slope near 1 minute is a warning sign.
How Timeframe Choice Changes Backtest Metrics and Model Behavior
A signature plot, realized volatility plotted against sampling interval, is the fastest way to see whether your chosen timeframe sits in a biased zone. The BIS sampling-frequency research documents that 1-minute sampling shows far fewer zero returns than 1-second sampling, but the zero-return fraction at 1 minute is still non-negligible in thinner markets, which flattens your signal and inflates apparent volatility.
This matters directly for machine learning features built on minute bars:
- Finer bars give you richer intrabar features (range, volume imbalance, tick count) but multiply the number of near-duplicate observations, which raises overfitting risk for any model with enough capacity to memorize noise.
- Coarser bars reduce feature count and training rows, which can underfit a genuinely short-horizon edge.
- The bias-variance trade-off shifts with every change in sampling frequency, so a parameter set tuned at 1m rarely transfers cleanly to 5m without retuning, and retuning itself is a red flag for overfitting rather than genuine edge discovery.
Walk-forward validation with a fixed purge gap between training and test windows is the standard defense against these fragile edges. The AlgoXpert IS-WFA-OOS protocol recommends rolling walk-forward folds with a fixed purge gap, expressed consistently in bars or trading days across every fold, specifically to prevent lookahead leakage from bleeding a few bars of future information into the training set. For intraday data this is unforgiving: a purge gap defined in calendar days means something different at 1m than at 5m, so the gap has to be recalculated for whichever timeframe you test.
Modeling Slippage, Latency, and Execution Realism for 1m vs 5m
A 1-minute strategy that looks profitable gross of costs often disappears once you apply a realistic fill model, because trade frequency and cost sensitivity scale together. BIS working paper 955 on latency arbitrage finds these microstructure races occur roughly once per minute per symbol for FTSE 100 stocks, fast enough to shape effective spread and price impact but far too fast for a 1-minute or 5-minute bar to resolve directly. What minute bars give you is the aggregate imprint of that activity, and 1-minute data captures it with more resolution than 5-minute data does.
Steps for modeling execution realistically:
- Assign a per-trade slippage estimate scaled to the instrument's typical spread and your order size, not a flat tick value.
- Add a commission and financing cost line to every simulated trade, not just a summary adjustment.
- Use tick-replay or every-tick simulation when your signal depends on intrabar extremes; aggregated bars suffice for signals built on bar-close values only.
- Cross-check your slippage assumptions against a documented slippage formula for minute bars.
Pro Tip: If your strategy's net return flips sign once you add a realistic slippage model, the edge was a cost-blind artifact of the timeframe, not a real signal.
Step-by-Step Checklist to Choose and Validate Your Timeframe
Run the same test twice, once on each timeframe, before trusting either result.
- Build paired backtests on 1-minute and 5-minute bars using identical entry and exit logic and the same execution model.
- Compute a signature plot and the zero-return fraction for your specific instrument and session; a steep bias near 1 minute, consistent with the BIS findings, argues for the coarser timeframe.
- Run walk-forward validation with a fixed purge gap, following the AlgoXpert WFA protocol, and check whether performance is stable across folds rather than concentrated in one.
- Resist retuning parameters separately for each timeframe unless you have a structural reason; a regime-filtered gold strategy on SSRN shows that structural references like VWAP and EMA hold up across sampling frequencies better than finely tuned thresholds.
- Compare net-of-cost metrics side by side, then confirm the surviving choice with a short paper-trade or live forward test before committing capital.
A coarser 5-minute or 15-minute approach, once transaction costs are modeled honestly, has been shown to hold up on a liquid instrument like XAU/USD when paired with structural rules instead of highly tuned parameters, according to the SSRN regime-filtered framework. That single data point is a reason to test both timeframes rather than assume finer is better.
How Clean Minute-Bar Data Supports These Tests
Paired 1m/5m testing only works if both datasets are clean and aligned, since a single bad tick or missing bar at one resolution will distort the comparison. We use minute-bar historical data across forex, metals, stock indices, bonds, and commodities since 2014, with datasets formatted for direct import into MT4 and MT5, which removes the reformatting step that usually introduces alignment errors between timeframes. An intraday data-cleaning process applies a documented spike test before any bar ships, which is exactly the kind of cleaning a signature-plot test assumes you already have.
To run the paired test above on a concrete instrument, you can pull BTCUSD 1mo and BTCUSD 5m side by side and run identical logic against both. For execution realism on MT5, our portfolio backtest walkthrough covers how to wire in slippage and commission assumptions.
Suggested first experiments:
- Run the signature plot described above on both BTCUSD datasets.
- Compare zero-return fractions between the two resolutions during low-liquidity hours.
- Re-run your walk-forward folds on each dataset and compare stability.
What Actually Matters When You Pick a Timeframe
Three heuristics hold up across most instruments. First, liquidity decides the floor: thin markets punish 1-minute sampling with noise, so default to 5-minute unless you have evidence otherwise. Second, an edge that needs retuning every time you change timeframe was never structural, it was curve-fit. Third, when either timeframe's signature plot looks unstable, that is your cue to escalate to tick data or a kernel-based volatility estimator rather than keep guessing at the next coarser bar.
— Start
Get Clean Minute Bars and Start the Paired Test
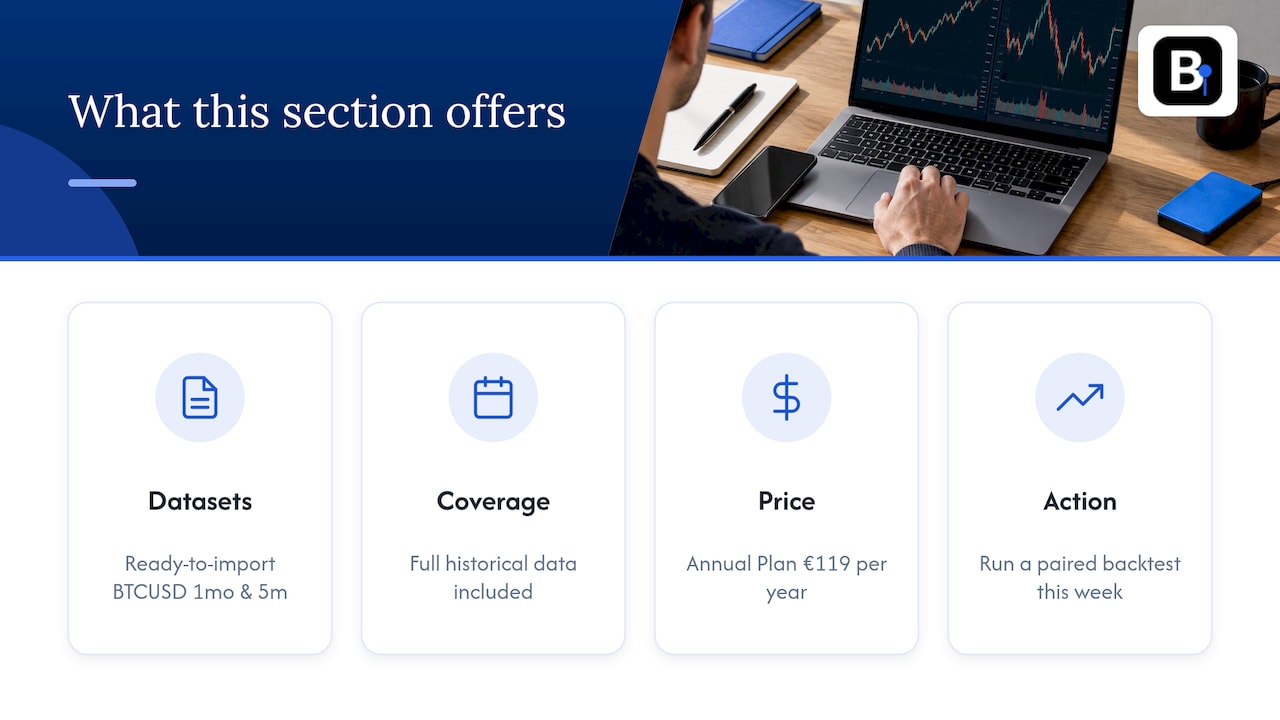
Clean, aligned minute data is what makes a 1-minute versus 5-minute comparison mean anything instead of just measuring noise in your pipeline. Ready-to-import BTCUSD 1mo and BTCUSD 5m datasets exist for exactly this kind of paired test, plus full historical data coverage and an Annual Plan at €119 per year for ongoing access.

Browse the datasets and run your first paired backtest this week.
This article is general information, not a substitute for advice from a qualified financial advisor. Consult a qualified financial professional about your own circumstances before acting on anything here.
FAQ
Is 1-minute data enough for a scalping strategy?
Often yes, provided you also model slippage and commission realistically, since scalping edges are the most sensitive to the execution costs that erode 1-minute signals. Confirm with a signature plot and a zero-return check specific to your instrument before relying on it.
When should I use 5-minute bars instead of 1-minute?
Use 5-minute bars when your instrument is thinly traded, when your edge relies on a structural reference like VWAP or an EMA, or when a signature plot shows meaningful bias at 1 minute. A regime-filtered gold strategy found 5-minute and 15-minute resolutions held up well once transaction costs were included.
What is a purge gap in walk-forward validation?
A purge gap is a fixed buffer of bars or trading days left out between your training window and your test window to prevent information from leaking across the boundary. The AlgoXpert WFA protocol recommends defining this gap consistently in the same unit across every fold.
Does 1-minute data let me see high-frequency latency races?
No. Minute bars cannot resolve microsecond-level events, but they do capture the aggregate price impact of those races better than 5-minute bars do, since BIS working paper 955 finds these races occur roughly once per minute per symbol on liquid stocks.
Where can I buy clean 1-minute and 5-minute datasets for backtesting?
We sell ready-to-import minute-bar datasets, including BTCUSD 1mo and BTCUSD 5m, formatted for MT4 and MT5, with an Annual Plan available for broader access. Pricing for individual historical data sets is available on request through our historical data page.
Sources
- A Regime-Filtered Intraday Trading Framework for Gold (SSRN)
- AlgoXpert Alpha Research Framework: IS–WFA–OOS protocol (ArXiv)
Recommended
- Quant Traders: One Line Fill Formula to Simulate Minute Bar Slippage
- Four Forex Minute Data Sources for Quants Ready for MT4/MT5
- Three Ways to Run an MT5 Portfolio Backtest With Clean Minute Bars
- Protect Your Backtest: 5-Step Audit for Handling Missing Bars
Related resources
Explore BacktestMarket's Expert Advisor robots to put the ideas in this article into practice.