

Six bar families cover nearly every backtesting and machine learning use case: time, tick, volume, dollar, imbalance, and run bars. Use dollar bars when you want economically consistent sampling across price regimes, tick or volume bars when trade count or size drives your signal, and imbalance or run bars when order-flow asymmetry is the thing you are trying to measure. The right choice depends on your data, your strategy's holding period, and how much compute you can spend on calibration.
TL;DR:
- Set thresholds by dividing average daily trade count, volume, or turnover by a target of a few hundred bars, then recalibrate as activity shifts.
- Imbalance and run bars depend on trade side labels; the tick test reached about 78% accuracy, versus roughly 94% for Lee Ready classification.
- For production, favor fixed thresholds; adaptive EWMA thresholds can overreact, while a warmup of 100 or more bars and alpha near 0.001 limits swings.
- Compare samplers at matched bar counts, then check return normality, lag one autocorrelation, and stability across volatility regimes before trusting apparent gains.
- Clean duplicate prints, spikes, and timestamp gaps before calibration; explicitly decide how to handle empty intervals, because forward filling can distort volatility.
Table of Contents
- Time-Based Bars: What They Are and Where They Break Down
- Tick Bars: Sizing Rules and Trade-Side Classification
- Volume and Dollar Bars: Normalizing by Size or Notional
- Imbalance and Run Bars: Reading Order-Flow Asymmetry
- Calibrating Thresholds and Validating the Results
- Why Clean, Verified Intraday Data Matters
- Case Studies in Bar Type Selection
- Common Pitfalls When Building Bars From Raw Ticks
- Production Stability Versus Research Flexibility
- BacktestMarket: Ready-to-Import Data for the Samplers Above
- FAQ
- Sources
Time-Based Bars: What They Are and Where They Break Down
Time bars aggregate trades or quotes into fixed intervals, one minute, five minutes, or an hour, producing standard OHLCV output. They are built by resampling a tick or quote stream and taking the open, high, low, close, and summed volume within each clock interval. Every charting platform defaults to this method because it is simple to compute and simple to read.
The construction is also the source of the bias. Markets do not generate information at a constant rate: volume clusters around opens, closes, and news events, then thins out overnight or during lunch hours in a given session. Fixed-clock sampling over-represents the quiet stretches and under-represents the bursts, which pushes returns toward heteroscedasticity and away from the roughly Gaussian behavior that many statistical models assume.
Time bars still earn a place in a quant's toolkit:
- Quick visual inspection of price action across a session or a multi-day chart.
- Lower-resolution backtests where millisecond precision adds no value to the strategy logic.
- A fallback when only minute-level OHLCV data is available rather than raw ticks.
One practical wrinkle: illiquid instruments or after-hours sessions generate empty intervals. Decide upfront whether to forward-fill the last close, drop the bar entirely, or flag it, because silently forward-filling can create phantom flat periods that distort volatility estimates downstream. Readers assembling their own minute data from scratch may find it faster to start from verified OHLCV minute data rather than resampling raw ticks for this baseline case.
Tick Bars: Sizing Rules and Trade-Side Classification
Tick bars close every time a fixed number of trades, N, have printed, regardless of how much time that takes. A thinly traded instrument might need an hour to fill a 500-tick bar; a liquid futures contract might fill it in seconds. That elasticity is the entire point: tick bars sample by activity, not by clock time, which smooths out the quiet-period bias that plagues time bars.
Choosing N is mostly a calibration exercise against your own data:
- Start from a target bar count per day (commonly a few hundred for intraday strategies) and back out N from average daily trade counts.
- Re-check the threshold periodically since trade frequency drifts with market regime and contract rollovers.
- Expect lower-liquidity instruments to need a much smaller N than index futures or major FX pairs to hit the same bars-per-day target.
Tick bars alone only tell you a trade happened, not whether it was buyer- or seller-initiated. Any imbalance or run-bar variant built on top of tick bars needs a trade-side classifier, and classification quality directly affects bar quality. Empirical comparisons in the itch bar sampling notebook show a simple tick-test running around 78% accuracy against roughly 94% for a Lee-Ready style classifier, a gap large enough to propagate noise into every downstream imbalance calculation.
For implementation, vectorized samplers (cumulative count with a reset on threshold crossing) scale far better than row-by-row loops on large tick files; memory becomes the binding constraint once you move past a few million rows per instrument.
Pro Tip: Build your tick-count threshold from at least one full month of recent data, not a single day, since daily trade counts swing with volatility regimes.
Volume and Dollar Bars: Normalizing by Size or Notional
Volume bars close once a fixed number of shares, contracts, or units have traded, rather than a fixed trade count. That matters because a single large block trade can carry more information than fifty small retail prints, and a pure tick count treats them identically. Volume bars correct for that by thresholding on cumulative size instead of trade count.
Dollar bars take the same idea one step further: the threshold is cumulative notional value (price times size), not raw units. That extra normalization makes dollar bars more stable across corporate actions, splits, and multi-year price drift, since the economic significance of a bar stays closer to constant even as the instrument's price level moves. This is why dollar bars are often the default recommendation for cross-asset or long-history backtests.
- Volume bars: threshold on cumulative traded units, reset the counter when the threshold is crossed.
- Dollar bars: threshold on cumulative price-times-size, same reset logic.
- Either method lets you roughly match bar counts across instruments trading at very different price levels, which time bars cannot do.
A minimal pseudocode pattern: maintain a running sum of volume (or dollar value) per incoming trade, append each trade to the current bar, and close the bar whenever the running sum meets or exceeds the threshold, then reset the accumulator to zero for the next bar. The same pattern works whether you are reading from a live feed or batch-processing a historical tick file, and it pairs naturally with dollar-bar concepts covered in our market data formats guide for readers deciding how to store the output.
Imbalance and Run Bars: Reading Order-Flow Asymmetry
Imbalance bars close when the cumulative signed flow, built from classified ticks, volume, or dollar value, exceeds an expected threshold in either direction. The mechanics follow a consistent pattern:
- Classify each trade as buyer- or seller-initiated using a tick-test or a Lee-Ready style rule.
- Accumulate a signed running total (theta) of ticks, volume, or dollar value as trades arrive.
- Close the bar once theta crosses a threshold derived from the expected imbalance under normal conditions, then reset.
Run bars work similarly but trigger on sustained runs of same-side activity rather than a net imbalance, which makes them useful for spotting persistent one-directional pressure, the kind associated with institutional accumulation or distribution, rather than a single lopsided print.
The threshold itself can be fixed, fully adaptive, or windowed. Fully adaptive thresholds, recalculated continuously via an exponentially weighted moving average, can spiral: a burst of imbalance pushes the expected threshold up, which suppresses new bar formation, which then overcorrects downward once the burst ends. Practitioner guidance in the ML4T Engineer alternative bars documentation recommends fixed-threshold samplers for production stability, with windowed estimation as a middle ground that bounds adaptation without full exponential drift. When an adaptive EWMA approach is used at all, a long warmup of 100 or more bars and a very small alpha, on the order of 0.001, keeps the threshold from reacting too violently to short-term noise.
Because the entire imbalance construction depends on correct buy/sell classification, the same Lee-Ready versus tick-test gap discussed for tick bars matters even more here: a weak classifier does not just add noise, it can invert the sign of the imbalance signal entirely.
Pro Tip: Log your classifier's accuracy on a labeled sample before trusting any imbalance or run bar output, since a 15-point accuracy gap between classification methods changes the bars themselves, not just their interpretation.
Calibrating Thresholds and Validating the Results
Picking a threshold is a backward calculation: decide on a target bar count per day, typically a few hundred for most intraday systems, then divide your estimated daily tick count, volume, or dollar turnover by that target to get a starting threshold. Re-estimate periodically since activity levels drift with volatility and corporate actions. For longer lookbacks, planning around roughly 20,000 bars for ten weeks of intraday history gives a useful anchor for how much raw tick data you will need to hit a stable bar count.
Once bars are built, test them rather than assuming they are better than a time-based baseline:
- Run a Jarque-Bera test on bar returns to check how close the distribution sits to normal.
- Check lag-1 autocorrelation; information-driven bars should show less serial dependence than time bars sampled at a comparable frequency.
- Verify bar-count stability across different volatility regimes, not just a single calm month.
- Always compare samplers at matched bar counts, not matched clock time, since raw advantages can disappear once frequencies are aligned.
One study found that tick-based Renko and tick-volatility bars delivered large reductions in serial dependence and random-walk deviation once frequency-matched against minute bars, though normality gains varied by regime. That single finding underlines why matched-frequency testing, not raw performance claims, should drive your sampler choice.
Before any of this, confirm the underlying tick or minute data is clean; a three-condition spike test catches bad prints that would otherwise distort every bar you build downstream.
Why Clean, Verified Intraday Data Matters
Every bar construction method above assumes the raw tick or minute stream is trustworthy. Bad prints, duplicated trades, or gaps in the feed propagate directly into threshold calibration and distort the Jarque-Bera and autocorrelation diagnostics used to validate a sampler.
We offer clean minute-bar intraday data across forex, metals, bonds, and stock indices going back to 2014, delivered in a format ready for direct import into MT4 and MT5.
- Documented, consistently maintained formats cut the preprocessing time needed before building dollar or imbalance bars.
- Direct access to engineer support helps when a dataset-specific question comes up mid-project.
- A verified, bar-by-bar data source reduces the risk that a sampler's poor statistical properties are actually a data quality problem in disguise.
Case Studies in Bar Type Selection
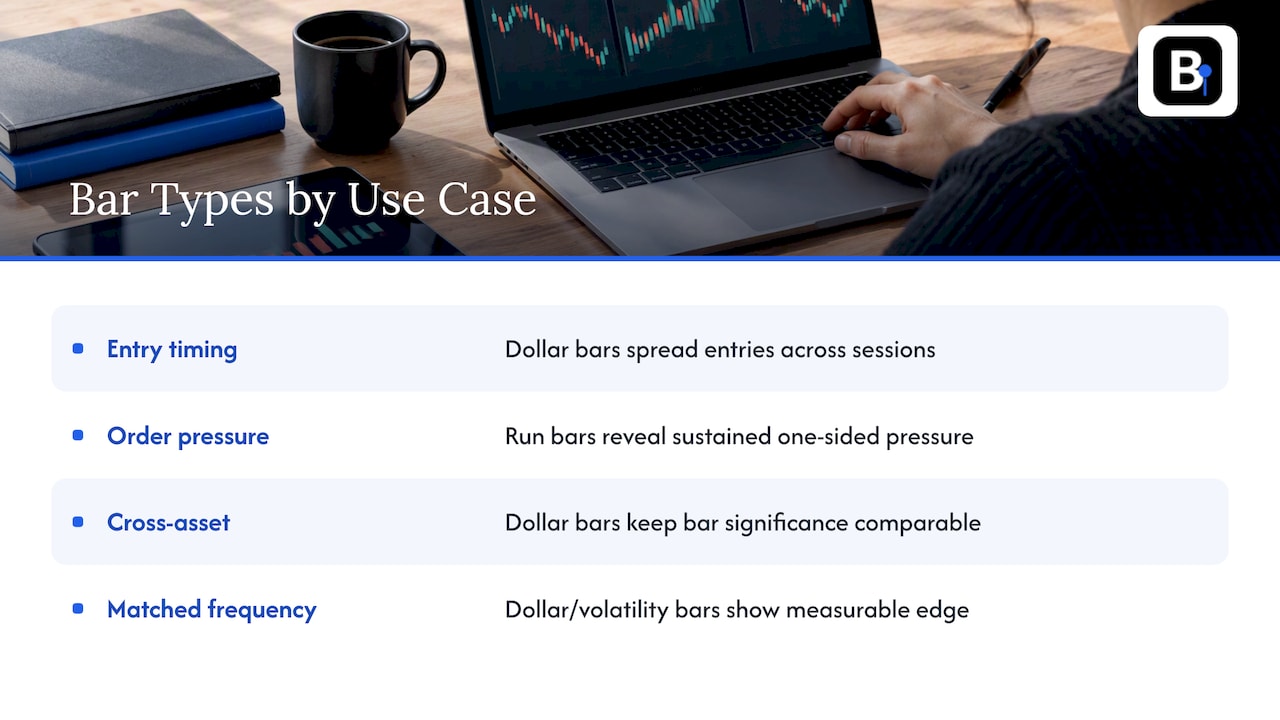
A trend-following system on a liquid index future illustrates the tick-versus-dollar tradeoff well. Built on time bars, the strategy's entry signals cluster around the open and close because those are the periods with the most clock-time volume, which skews the backtest's apparent edge toward session-open behavior. Rebuilding the same signal logic on dollar bars spreads entries more evenly across the session, since each bar now represents roughly equal notional turnover rather than equal clock time, and the resulting equity curve shows smoother drawdowns because the sampling itself stops concentrating risk around specific hours.
A market-microstructure strategy aimed at detecting short-term order-flow pressure benefits from the opposite kind of example. Built on run bars, the signal triggers when one side of the tape sustains pressure longer than the historical baseline would predict, a pattern that time bars simply cannot surface because a run spanning three minutes and a run spanning thirty look identical once chopped into fixed clock intervals. The frequency-controlled comparison of tick- and minute-based information bars supports this pattern generally: tick-based dollar and volatility bars showed measurable statistical advantages over minute bars once compared at matched frequency, though the size of the advantage shifted with market regime, a reminder that no single bar type wins in every case.
A cross-asset portfolio backtest spanning instruments with very different price levels, say a stock index and a metals future, benefits from dollar bars specifically because they keep bar count and bar significance comparable across instruments that would otherwise need wildly different tick or volume thresholds.
Common Pitfalls When Building Bars From Raw Ticks
Most problems with custom bar construction trace back to one of a handful of recurring mistakes, not to the underlying theory.
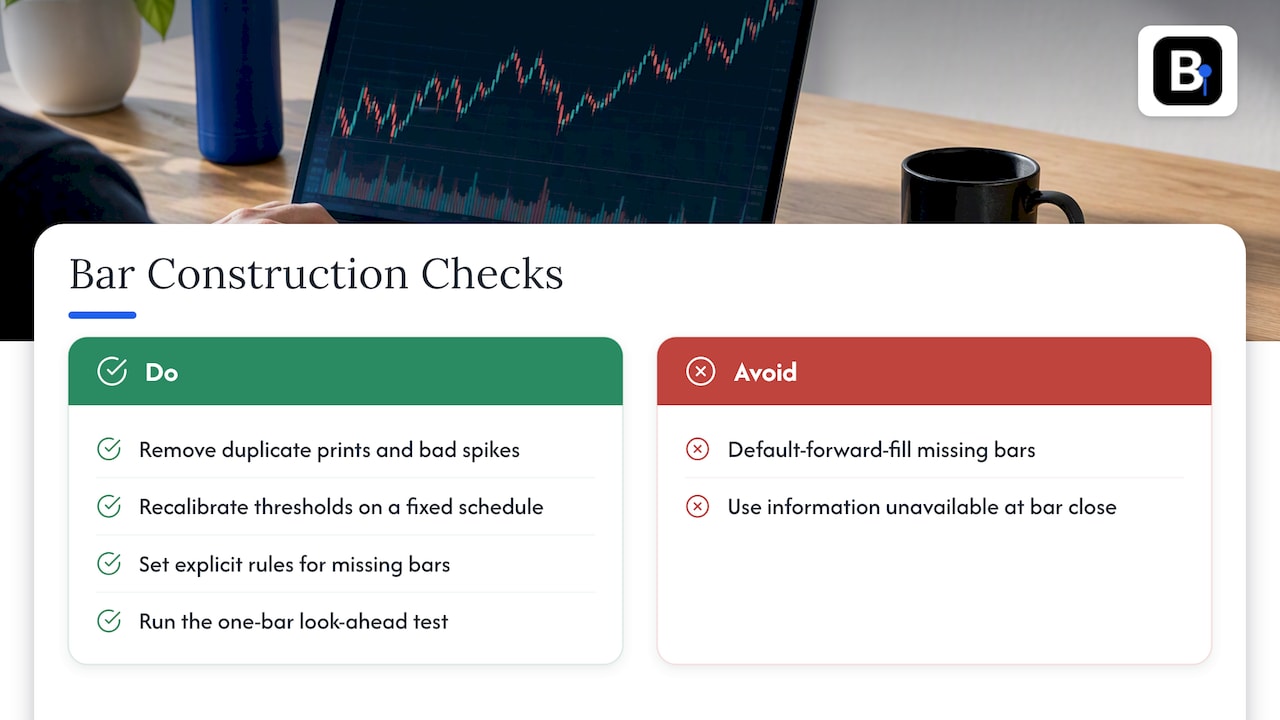
Unclean source data is the most common root cause. Duplicate trade prints, outlier spikes from bad feed handling, and missing timestamps all corrupt the cumulative counters that volume, dollar, and imbalance bars depend on, and the error compounds because a single bad tick can trigger an early bar close or delay a legitimate one.
Threshold drift is the second major trap. A threshold calibrated on one month of data can become stale within a quarter as volatility and liquidity shift, silently changing bar counts and making before-and-after strategy comparisons unreliable. Re-calibrating on a fixed schedule, rather than once at project start, avoids this.
Classification errors in imbalance and run bars deserve their own caution: a tick-test misclassifying trades at a meaningfully lower rate than a Lee-Ready approach will generate systematically biased imbalance signals, not just noisier ones.
Missing or gapped bars, particularly around holidays, rollovers, or illiquid overnight sessions, need an explicit handling rule rather than a default forward-fill, since silent gap-filling can mask the very discontinuities a strategy should be reacting to. A structured audit for missing bars is worth running before trusting any backtest built on custom sampling. Finally, look-ahead bias can creep in during bar construction itself if a classifier or threshold uses information not actually available at the time a bar closes; the one-bar test for catching look-ahead bias is a useful check to run before relying on any new sampler in production.
Production Stability Versus Research Flexibility
Our take: fixed thresholds belong in production because reproducibility matters more than marginal statistical gains once real capital is on the line. Adaptive and windowed methods earn their place in research, where the goal is finding what the data rewards, not keeping a live system boringly predictable.
The discipline that connects both modes is the same: validate with matched-frequency tests and robust cross-validation before trusting any sampler's apparent edge over another.
— Start
BacktestMarket: Ready-to-Import Data for the Samplers Above
Building any of these bar types starts with trustworthy raw data, and that is the part we solve. Our Historical Data sets, including S&P 500 Back Adjusted 1mo, arrive cleaned and ready for MT4/MT5 import, so threshold calibration starts on day one instead of after weeks of data wrangling.
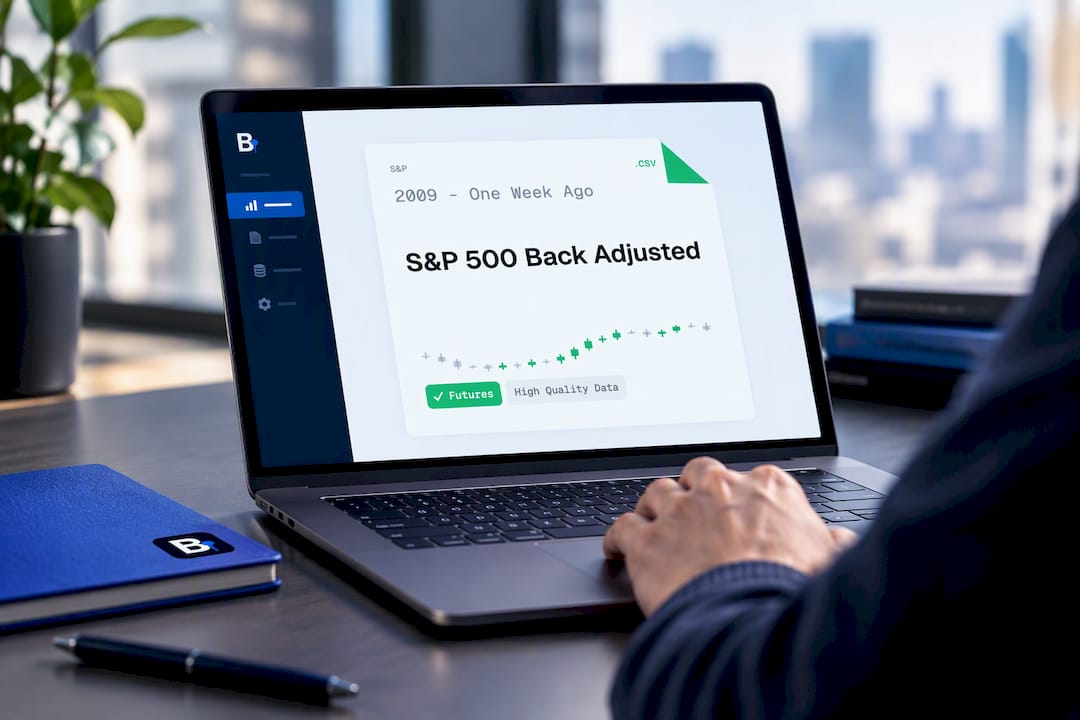
An Annual Plan at €119 per year covers ongoing access, and our engineers answer dataset-specific questions directly. Browse the Historical Data catalog to find the instrument you need.
FAQ
What are the main types of bar aggregation?
The main families are time, tick, volume, dollar, imbalance, and run bars. Time bars sample by clock interval, tick and volume bars sample by trade count or size, dollar bars sample by notional value, and imbalance or run bars sample by order-flow asymmetry.
What is an aggregation method in trading data?
An aggregation method is the rule that groups raw trades or quotes into discrete bars for analysis, typically by elapsed time, trade count, traded size, notional value, or signed order-flow imbalance. The choice determines how evenly information is distributed across the resulting bars.
What are the best tools for building bar aggregations?
Practitioner-oriented samplers such as the TickBarSampler, VolumeBarSampler, and DollarBarSampler shown in the itch bar sampling examples and the function-level APIs in the Horizon SDK bars and labeling docs cover tick, volume, dollar, imbalance, and run bar construction with documented parameter choices. Clean source data from a provider like our Historical Data sets reduces preprocessing before any of these tools run.
How do bar aggregation methods affect backtesting accuracy?
Bars that sample by activity rather than clock time, such as dollar or volume bars, tend to produce returns with less serial dependence and more stable statistical properties, which can make a backtest's performance metrics more representative of real trading conditions. The advantage is regime-dependent, so matched-frequency comparisons against a time-bar baseline are the reliable way to confirm it for a specific strategy.
How do I choose a bar type for a specific trading style?
Match the bar type to what drives your signal: dollar bars for cross-instrument or long-history consistency, tick or volume bars when trade count or size is the core input, and imbalance or run bars when order-flow pressure itself is the signal. Validate the choice with a Jarque-Bera test, lag-1 autocorrelation, and a matched-frequency comparison before committing to it in production.
Sources
- A Frequency-Controlled Comparison of Tick- and Minute-Based Information Bars for Cryptocurrency Markets
- ML4T Engineer - Alternative Bars and guidance
- ML4T Engineer - itch bar sampling (Stefan Jansen examples)
- Bars & Labeling - Horizon SDK
Recommended
- Protect Your Backtest: 5-Step Audit for Handling Missing Bars
- Three Ways to Run an MT5 Portfolio Backtest With Clean Minute Bars
Related resources
Explore BacktestMarket's historical data packs to put the ideas in this article into practice.