

A rolling window backtest fits or evaluates a strategy on a fixed-length block of history, moves that block forward in time, tests on the period right after it, and repeats until the data runs out. Instead of one score from one slice of history, you get a series of scores. That series tells you whether the strategy works in many market conditions or only in one lucky stretch.
This guide covers the mechanics, the arithmetic of window counts, how to choose window length and step, how a rolling window differs from an expanding one, and the leaks that quietly ruin the results.
TL;DR
- A rolling window backtest slides a fixed-length training block through your history and tests on the period that follows each block, so you see performance across many periods, not one.
- Pick the window length from your data frequency and sample size, make the test period at least as long as the horizon you actually trade, and keep the step consistent.
- Use a rolling window when regimes shift and old data may mislead. Use an expanding window when more history reliably helps.
- Windows overlap, so the results are not independent evidence. Read the spread and the worst windows, not just the average.
- Clean, gap-free minute bars matter more here than in a single backtest, because bad bars get re-used in every window that contains them.
Table of Contents
- What a rolling window backtest actually does
- Rolling window vs. expanding window
- Choosing window length, step and test horizon
- Setting it up without look-ahead bias
- Reading results across overlapping windows
- Where rolling windows fall short
- Why data quality matters more in a rolling test
- Our perspective
- Running it on clean minute data
- A practical checklist
- FAQ
- Sources
What a rolling window backtest actually does
The procedure has four moves. Take a block of past observations of fixed length. Fit the model, or set the strategy's parameters, on that block. Run it forward over the next test period, which is data the model has not seen. Then shift the block forward and do it again.
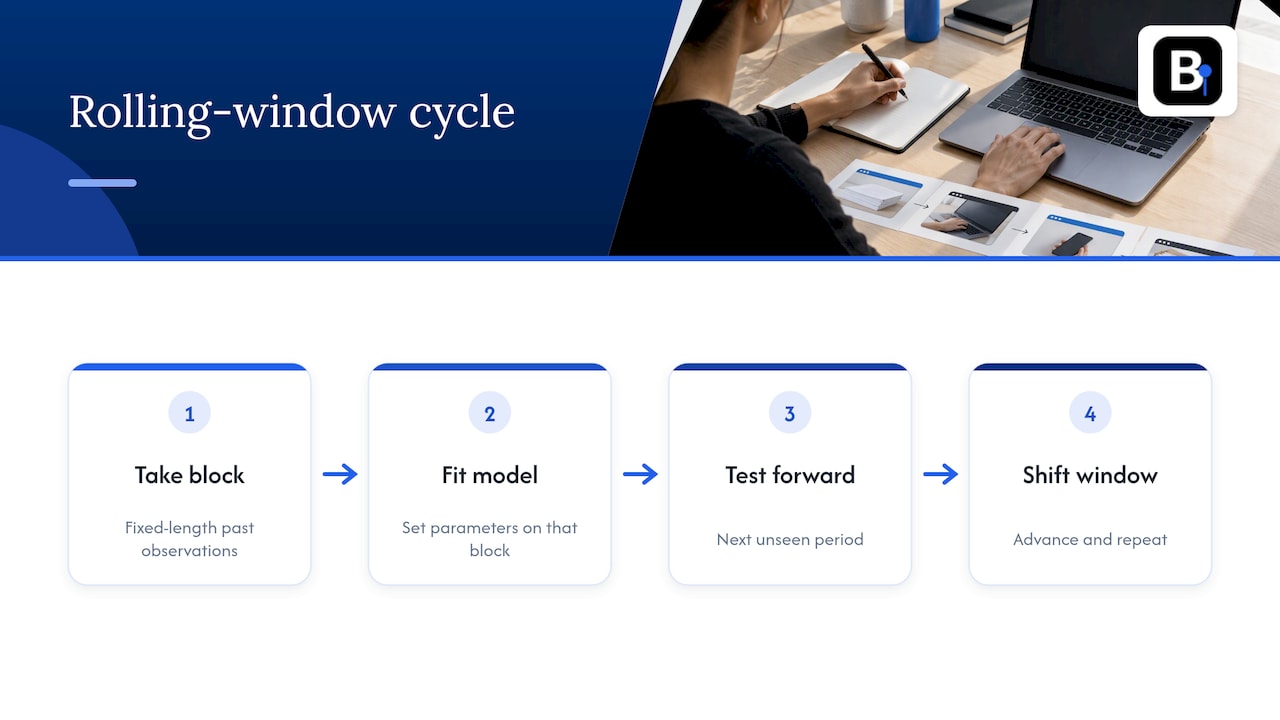
The arithmetic is simple. In MathWorks' documentation on rolling-window analysis, a series of T observations with a window of m observations, advanced one observation at a time, produces T − m + 1 windows: observations 1 to m, then 2 to m+1, and so on. The step does not have to be one period. A larger step gives fewer, less overlapping windows and a faster run.
A quick example. Say you have 10 years of daily data, about 2,520 trading days, and you use a 504-day window (roughly two years) with a 21-day step and a 21-day test period. You get a little under 96 evaluations, each one scoring a month of out-of-sample trading, each trained on the two years before it. Join the test periods and you have a continuous out-of-sample track record where every day was traded by parameters that only knew the past.
One framing is worth keeping in mind: a rolling window backtest is a diagnostic, not a trading signal. It does not generate returns. It tells you how stable your idea is when the training sample keeps changing.
Rolling window vs. expanding window
The two schemes differ only in what happens to the start of the training block.
In an expanding backtest the start stays fixed and the training set grows at each iteration. In a rolling backtest the start moves forward as well, so the training set keeps its length. The Kats time-series library documentation describes exactly this split.
| Rolling window | Expanding window | |
|---|---|---|
| Training start | Moves forward | Fixed at the first observation |
| Training size | Constant | Grows each step |
| Memory | Forgets old data | Keeps everything |
| Estimate noise | Higher, smaller sample | Lower, larger sample |
| Reaction to regime change | Faster | Slower |
| Best when | Behavior drifts over time | Relationships are stable |
The trade-off is the one SlackQuant's research note on rolling versus expanding windows describes: expanding windows cut estimation noise by keeping more data, while rolling windows respond faster to structural change by dropping stale regimes, at the price of noisier estimates from a smaller sample.
In practice, run both. If the rolling and expanding results agree, you have learned something reassuring about robustness. If they diverge sharply, the strategy depends on how much history it sees, and that is a finding in itself.
Choosing window length, step and test horizon
There is no universal number. There are three decisions, and each has a defensible way to make it.
Window length
MathWorks' guidance is to choose the window size from the sample size and the periodicity of the data: shorter intervals can use shorter windows, longer intervals larger ones, and longer windows tend to give smoother estimates. For a strategy built on one-minute bars, a window of a few months may contain millions of observations. For a monthly macro rotation model, a window of a few months contains a handful.
A useful check is to count not bars but independent decisions. If your strategy trades twice a week, a 6-month window holds around 50 trades. That is thin for fitting more than a couple of parameters. Lengthen the window or cut the parameter count.
Test horizon
Make the test period match the decision you will really live with. OpenForecast's guidance says there is no strict rule for training and test set sizes: design the experiment around business needs and make the test set at least as long as the forecast horizon. If you re-optimize monthly in live trading, test one month at a time. If you hold positions for a quarter, a one-week test tells you little.
Step size
A step equal to the test period gives non-overlapping test segments that chain into one clean out-of-sample curve. A smaller step gives more windows and smoother plots, but the tests overlap and the extra windows add less information than they appear to. Start with step equal to test length, then shrink it only if you need finer resolution on when performance changes.
Setting it up without look-ahead bias
A rolling backtest looks rigorous, which makes its leaks more dangerous. A few rules cover most of the damage.
- Respect the knowledge time. Use only data that would have been known at the decision timestamp, and account for publication delays, processing time and revisions. This is the information-set discipline that look-ahead bias references describe.
- Fit transformations inside each window. Scalers, normalizers, feature selection and parameter optimization must be fitted on the training block only. Fitting a z-score on the whole series before slicing windows lets future volatility leak into every window.
- Align rolling features carefully. A 20-bar moving average computed at bar t must use bars up to t, not t+1. Off-by-one errors at window boundaries are the most common culprit.
- Keep test data untouched. If you look at test results and then retune the window length, the test data has become training data. Hold back a final segment you evaluate once.
- Mind execution timing. Signals computed on a bar's close cannot trade at that bar's open.
The cost of getting this wrong is real. In 2014 the SEC charged an investment manager with false performance advertising, noting that backtested buy and sell decisions had been shifted back by a week, inflating results by approximately 350%. Our own walkthrough of look-ahead bias for quants lists the leaks to check before you sign off a result.
Reading results across overlapping windows
You now have dozens of numbers. How you read them decides whether the exercise was worth it.
Look at the distribution, not the mean
OpenForecast makes the point that a longer test period yields a distribution of error measures and shows whether performance is consistent across different periods. For trading, plot the metric you care about (Sharpe ratio, profit factor, drawdown, hit rate) for every window. A strategy with a modest, steady score in 90 of 96 windows is a different animal from one with a high average built on five huge windows.
Remember the windows are not independent
With a one-month step on a two-year window, adjacent training blocks share 23 of 24 months. Their parameter estimates will be almost identical and their results strongly correlated. Ninety-six windows is not ninety-six independent trials. Treat the count as resolution along the time axis, not as sample size for a significance test.
Examine the worst windows
Sort the windows by performance and read the bottom ten percent. Which dates are they? If they cluster around one event or one volatility regime, ask whether that regime will return, and whether you could survive it. A window that breaks is information about the strategy's conditions, not noise to be trimmed.
Watch parameter stability
If the optimal parameters jump around from window to window, the strategy is fitting noise. Stable parameters across windows are a stronger sign than any single high return.
Beware of the null result
Rolling out-of-sample testing does not turn a weak idea into a good one. In a study using 155 years of data, Zakamulin found no statistically significant evidence that market timing strategies beat the market in the second half of the sample, and neither out-of-sample estimation scheme improved the timing rules. Honest testing often says no. That is its job.
Where rolling windows fall short
- They discard history. Dropping old data helps when behavior changes, but a rare crisis that left the window is no longer in your test. Pair the rolling run with a stress test. Our guide to Monte Carlo backtesting shows one way.
- Short windows are noisy. Parameters estimated on little data swing wildly.
- The window length itself is a parameter. Try ten lengths, pick the best, and you have overfit again. Report a range of lengths and show the results are similar.
- They are not a holdout. Keep a final untouched segment as well.
The related method of walk-forward analysis adds optimization inside each training block and trades the next segment with the winning parameters. Rolling window testing is its close relative, and the two share the same discipline.
Why data quality matters more in a rolling test
In a single backtest, a bad bar affects one stretch. In a rolling backtest, every window that contains that bar re-uses it. A missing hour, a spike that never traded or an unadjusted roll in a futures series gets counted again and again, in training and in testing, and it can shift parameter estimates in a dozen windows at once.
Three data properties deserve a check before you run anything:
- Continuity. Gaps in minute bars change rolling indicator values and can misplace window boundaries.
- Consistent time zone and session definitions. A shift of a few hours mid-series changes what a daily bar means.
- Documented adjustments. For futures-derived series, know how contracts were stitched, and whether prices were back-adjusted.
The same logic applies to portfolios. If you combine strategies, replay them on identical data, as we explain in portfolio backtesting in MT4.
Our perspective
We supply data, and we see the same pattern from the receiving end. Traders spend weeks refining window lengths and step sizes, then run them on a series with silent gaps, duplicated bars or undocumented adjustments. The elegant method inherits every flaw in the input.
Our view is that a rolling window backtest is only as honest as the bars under it. That is why we put effort into bar-by-bar verification, documentation of adjustments and datasets ready to import into MT4 and MT5 without cleanup. It is also why our support comes from the engineers who collect the data, so a question about a suspicious bar gets an answer from someone who can look at it.
Our practical advice: freeze the strategy logic before you pick windows, run rolling and expanding side by side, report the worst windows first, and never tune on the final holdout. A modest result you can trust beats a brilliant one you cannot reproduce.
— Start
Running it on clean minute data
If you test intraday strategies, you need long, consistent minute history so each window holds enough bars. Our historical data sets cover forex, metals, stock indices, bonds and commodities in minute bars since 2014, delivered as a complete download you can import into MT4 or MT5. If you are starting with currencies, the Forex Major Full Pack is the place to begin. The Annual Plan costs €119 per year.
A practical checklist
- Write down the strategy rules and the metric you will judge before touching the data.
- Inspect the data for gaps, duplicates and session shifts.
- Choose the window length from the data frequency and the number of trades it will hold.
- Set the test length to the horizon you will trade, and the step equal to the test length.
- Fit every transformation inside each training block.
- Run rolling and expanding versions.
- Plot the metric per window and read the worst ones.
- Check parameter stability and sensitivity to window length.
- Stress-test, then evaluate once on a final untouched segment.
FAQ
What is the difference between a rolling window and walk-forward testing?
They are close relatives. A rolling window backtest slides a fixed-length block through history and scores each next period. Walk-forward analysis usually also re-optimizes the parameters on each block before trading the following segment.
How long should the window be?
There is no fixed rule. Base it on the sample size and data frequency, and make sure each window holds enough trades to support the number of parameters you fit. Test several lengths and report the range rather than the best one.
When is an expanding window better?
When more history reliably improves your estimates and the relationships you model are stable. A rolling window suits cases where regimes change and old data may no longer apply. Running both shows you which case you are in.
Does a rolling window backtest prevent overfitting?
No. It reduces one kind of risk by always testing on unseen data, but you can still overfit by tuning window length, step or rules after seeing the results. Freeze the logic first and keep a final holdout.
Sources
- Rolling-Window Analysis of Time-Series Models, MathWorks
- kats.utils.backtesters module, Kats documentation
- Rolling vs Expanding Windows, SlackQuant Research
- What about the training/test sets?, OpenForecast
- Look-ahead bias in backtesting, python.financial
- SEC charges investment manager F-Squared
- A Comprehensive Look at the Empirical Performance of Moving Average Strategies, Zakamulin (SSRN)
Recommended
- MT4 Portfolio Backtesting: Export Replay to Find Real Drawdowns
- Monte Carlo Backtesting: How to Stress-Test a Strategy
- Out-of-Sample Testing: How to Validate a Trading Strategy
- Three Ways to Run an MT5 Portfolio Backtest With Clean Minute Bars
Related resources
Explore BacktestMarket's historical data packs to put the ideas in this article into practice.