

Monte Carlo backtesting takes the result of an ordinary backtest and asks a harder question: how would this strategy have done across many plausible histories, not just the single one that happened? You reshuffle trades, resample returns or perturb price data thousands of times. Then you read the spread of outcomes instead of one equity curve. If the strategy only works on the exact sequence you tested, the simulation shows it.
This guide covers the main methods, how to run them step by step, how to read the output, and where the technique fails. It also covers the data quality problem that sits underneath all of it.
TL;DR
- A normal backtest gives you one path. Monte Carlo gives you a distribution of paths, so you can see drawdown, return and ruin risk as ranges.
- The two most common methods are trade-order shuffling (bootstrapping your trade list) and candle-based simulation on modified or synthetic price data.
- Simulation cannot repair bad inputs. If the trade list comes from gappy or unclean minute data, you are only measuring the noise more precisely.
- Never assume normal returns without checking. Real markets have fat tails and negative skew, and a normal model understates the damage.
- Read percentiles, not averages: the 95th percentile drawdown matters more than the median.
Table of Contents
- What Monte Carlo backtesting actually does
- The main methods
- How to run a Monte Carlo test, step by step
- Reading the results
- Where Monte Carlo goes wrong
- Monte Carlo is not a replacement for walk-forward testing
- Our perspective: the data comes before the simulation
- Getting clean minute data for the test
- A practical workflow you can copy
- FAQ
- Sources
What Monte Carlo backtesting actually does
A standard backtest replays one specific past sequence of prices and trades. Monte Carlo analysis, as CFA Institute's backtesting and simulation reading describes it, simulates a large number of potential outcomes so you can approximate the full distribution of results, including how likely different performance levels are. It does this by varying parameters, shuffling trade order or generating synthetic data.
That shift matters because a single equity curve hides luck. Two strategies can post the same net profit, yet one got there by a smooth sequence of wins and the other by surviving a streak of losses that happened to come early. In live trading you do not get to pick the order. Monte Carlo shows you the orders you could have gotten.
Some quantitative researchers go further and treat the default stance toward any backtest as disbelief. In that framing, covered in the strategy simulation chapter of ML for Trading, Monte Carlo is a falsification tool. Its job is to try to break the strategy, not to confirm that it looks good. That is a useful attitude to bring to every run.
The main methods
Trade-order shuffling (bootstrapping)
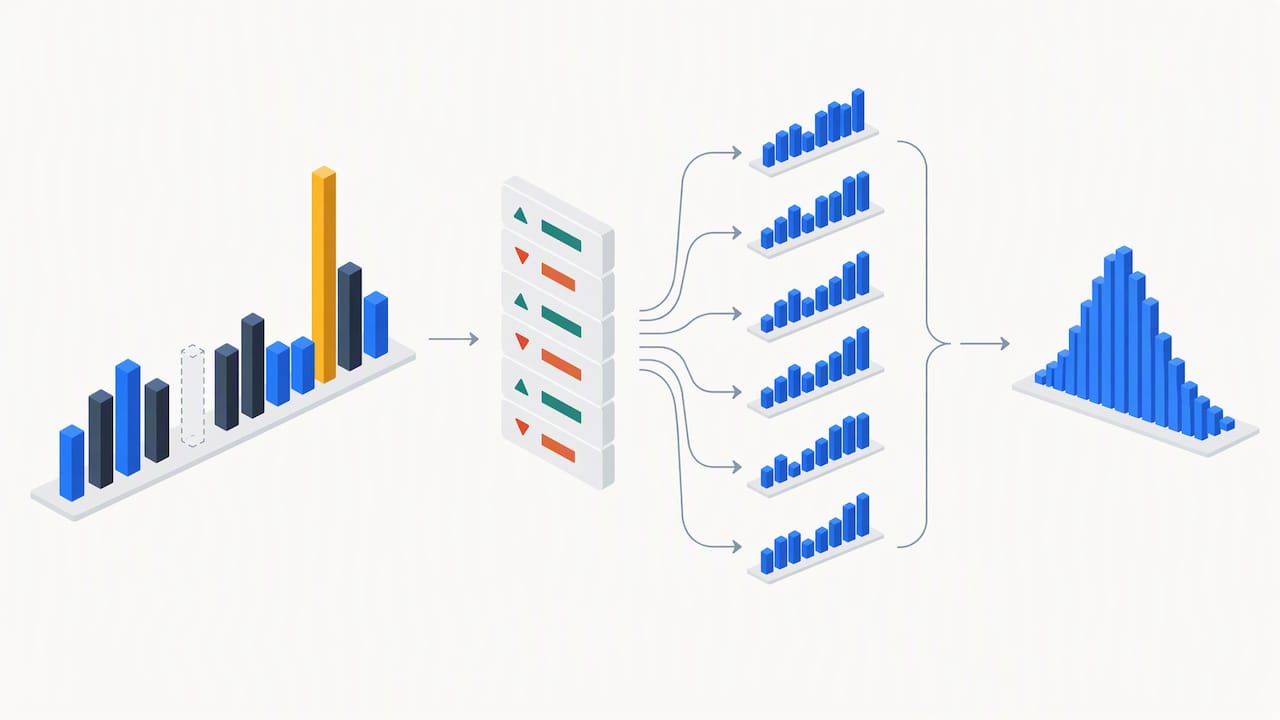
This is the simplest and most common approach. You take the list of closed trades from your backtest and draw from it at random, with replacement, to build many alternative equity curves. AmiBroker's documentation calls bootstrapping the most straightforward and reliable way to run the computation. Because it uses real trade outcomes, it exposes the risk hidden in trade sequence without modeling external market factors.
The catch is in the assumption. It treats your historical distribution of trade results as representative of the future. If your sample came from one volatility regime, the shuffled curves inherit that bias. Shuffling also destroys any serial dependence between trades, such as streaks that cluster in trending or choppy markets.
Candle-based simulation
Here you do not reorder trades. You re-run the strategy against modified or synthetic market data that keeps the structural patterns of the market. The Jesse documentation on Monte Carlo analysis lists both approaches: trade-order shuffling and candle-based simulation. They test different parts of a strategy. Shuffling tests sensitivity to sequence. Candle-based tests whether the logic holds when the price path itself changes.
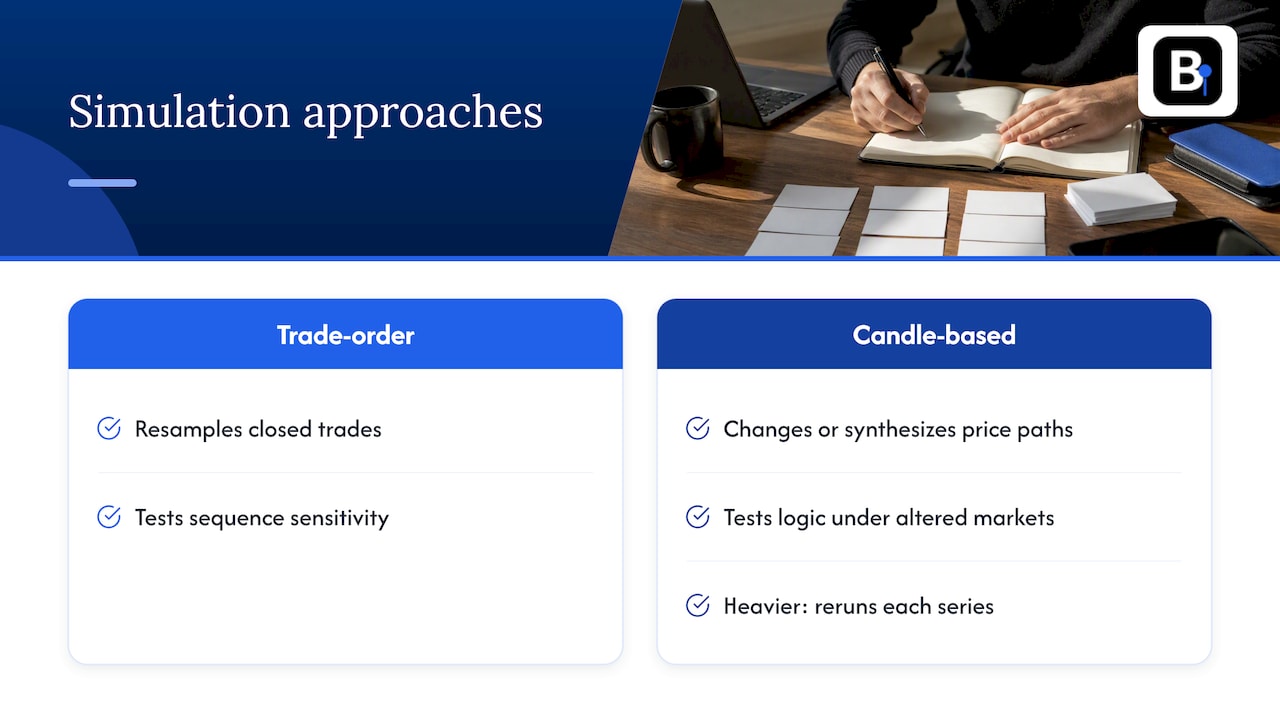
Candle-based runs are heavier, because the strategy has to be executed again for every simulated series. They also expose over-fit entry rules better. A system tuned to the exact wiggles of one year of data tends to fall apart when those wiggles are perturbed.
Parameter variation
A third approach randomly nudges inputs such as lookback lengths, stop distances or spread assumptions across a plausible range. If performance collapses when a moving average goes from 50 to 55, you have found a fragile optimum. This pairs naturally with the overfitting checks in our guide on how to manage overfitting in trading systems.
| Method | What it varies | What it answers | Main weakness |
|---|---|---|---|
| Trade-order shuffling | Sequence of trades | How bad can drawdown get from bad luck in ordering? | Assumes past trade distribution is representative |
| Candle-based simulation | Price series | Does the logic survive a different path? | Synthetic data may miss real market structure |
| Parameter variation | Strategy inputs | Is the optimum robust or a spike? | Needs a sensible range to sample |
How to run a Monte Carlo test, step by step
- Start with a clean, complete backtest. Use the longest sample you trust, with realistic spread, commission and slippage. Our piece on transaction costs in backtesting covers how to test several cost regimes.
- Export the trade list. You need profit or loss per trade, ideally in R-multiples or percent of equity so position sizing is comparable.
- Choose the method. For a first pass, bootstrap the trades. Add candle-based or parameter variation once the basic result looks sound.
- Set the number of runs. Practitioners often run thousands of simulations, for example 10,000, so the output distribution converges, according to the CFA Institute reading. Run a few thousand, then run again with a different seed. If the percentiles move a lot, you need more runs.
- Record the outputs per run. Final equity, maximum drawdown, longest losing streak, and whether the account hit your ruin threshold.
- Read the distribution. Look at the 5th, 50th and 95th percentiles, not the mean.
- Decide in advance what fails. For example: reject the strategy if the 95th percentile drawdown exceeds what you can tolerate, or if more than a set share of runs end below the starting balance.
Reading the results
The point of the exercise is to replace one number with a range. Suppose your backtest shows a 14% maximum drawdown. The simulation might show a median worst drawdown of 17% and a 95th percentile of 29%. The 14% was one draw from that range, and probably a kind one. (These figures are an illustration, not a result from any real strategy.)
Useful readings:
- Drawdown percentiles. Size your positions against the bad tail, not the median.
- Probability of ruin. The share of simulated paths that breach a loss limit you define, such as an account stop or a prop-firm drawdown rule.
- Return spread. If a large part of the distribution ends flat or negative, the edge may be thin.
- Losing streak length. It tells you what you have to be able to sit through psychologically and financially.
If a strategy looks fine at the median and unacceptable at the 95th percentile, the answer is usually smaller size, not abandoning it. If the median itself is weak, the backtest was probably flattered by luck or by overfitting.
Where Monte Carlo goes wrong
The normal distribution trap
When you simulate returns instead of resampling trades, the distribution you choose is the most critical decision. Many researchers default to a multivariate normal because it is simple. The CFA Institute material warns that this is often inadequate, because it cannot capture fat tails and negative skewness that actual asset returns show. A normal model will tell you that a five-sigma day is practically impossible. Markets disagree on a regular basis.
Weak random number generation
Simulation depends on random number generators. CFA Institute's model validation brief notes that the generator must be robust and properly seeded, because poor pseudo-random quality can introduce bias that is not obvious. In practice, use a well-tested library generator, record your seed, and do not write your own.
Garbage in, precisely measured garbage out
Monte Carlo resamples what you give it. If the underlying backtest ran on bars with missing minutes, bad ticks, unadjusted rollovers or duplicated sessions, the trade list is already wrong. Shuffling it a thousand times just builds a confident-looking distribution around a flawed center. A stop that triggered on a phantom spike will be treated as a real loss, and a missed move will never appear in the sample at all.
It does not fix lookahead or survivorship bias
Simulation tests sensitivity to luck. It does not detect a strategy that peeks at future data. Run your bias checks first, then simulate.
Monte Carlo is not a replacement for walk-forward testing
The two answer different questions. Walk-forward analysis tests whether parameters chosen on one window still work on the next, unseen window. Monte Carlo tests how much of the result depends on the order and path of events. A sound process uses both: optimize and validate walk-forward, then simulate the validated trade list to size risk. We cover the first half in our walk forward analysis guide.
For a different asset class, the same logic applies to derivatives. The principle that a backtest can look strong because of one favorable historical path comes up in options work as well, as discussed in this practical guide to backtesting options strategies.
Our perspective: the data comes before the simulation
Most of the Monte Carlo content you will find focuses on the simulator. We sell data, so we come at it from the other end. Engineers on our side collect and verify minute-bar history, and the questions that reach them are rarely about the simulation. They are about why a backtest does not reproduce, why modeling quality is capped, or why a gap appears in one year.
Our view is this:
- Verify the data before you resample anything. A bar-by-bar check for gaps, outliers and session errors takes an afternoon. Our 7-step data audit for MT4 and MT5 is the checklist we would run.
- Document adjustments. For futures, back-adjustment changes price levels. If you do not know how, you cannot judge whether a stop distance in the test was realistic.
- Use the same data for every run. If you compare strategy variants on different feeds, the difference you see may be the feed. Keep one consistent dataset so the only thing that varies is the Monte Carlo seed.
- Treat the simulation as a falsification step. If a strategy survives clean data, realistic costs and a hostile simulation, you have earned some confidence. If it survives only one of those, you have not.
- Test the portfolio, not only each system. Correlated drawdowns are where accounts break, and that is covered in our write-up on MT4 portfolio backtesting.
— Start
Getting clean minute data for the test
If you run MT4 or MT5, the trade list feeding your simulation is only as good as the history behind it. We publish complete, clean minute-bar data sets since 2014 across forex, metals, stock indices, bonds and commodities, as a one-time download that imports directly into MT4 and MT5. You can browse the historical data library or start with the Forex Major Full Pack if your strategies trade the majors. Prefer ongoing access? The Annual Plan is 119 EUR per year.

A practical workflow you can copy
Here is a compact sequence that combines the pieces above:
- Audit the minute data for the symbols and years you will test. Fix or exclude gaps. See the per-year gap audit for MQL4.
- Backtest with conservative spread and slippage assumptions.
- Check for overfitting and validate walk-forward.
- Export trades and bootstrap them with at least several thousand runs.
- Add a candle-based or parameter-variation run to test the logic, not only the sequence.
- Set a rule in advance, for example a maximum acceptable 95th percentile drawdown, and size positions so the strategy passes it.
- Re-run when you change data, costs or rules. A stale simulation is as misleading as a stale backtest.
If you are testing on more than one symbol, keep in mind that engine costs and correlations change the results. Our multi symbol backtesting article is a good companion for that step.
FAQ
What does a Monte Carlo simulation tell you about a trading strategy?
It tells you how wide the range of plausible outcomes is, instead of giving you one historical result. You see how deep drawdowns could get, how long losing streaks could last, and how often the account would hit a loss limit. It does not predict the future. It shows how much of your backtest depended on luck.
How many simulations do I need?
There is no fixed number, but practitioners commonly use thousands, such as 10,000, so the output distribution stabilizes. A practical test is to run twice with different seeds. If the key percentiles barely move, you have enough runs. If they shift noticeably, add more.
Can I do a Monte Carlo simulation in Excel?
Yes, for trade-order bootstrapping. Paste the trade results into a column, sample from them at random with replacement to build many equity curves, and record the maximum drawdown for each. It gets slow with large numbers of runs, so many traders move to Python, R or built-in features in their trading software for heavy work.
Is Monte Carlo testing enough to validate a strategy?
No. It measures sensitivity to luck and sequence, not the quality of the inputs or hidden bias. You still need clean historical data, realistic costs, checks for lookahead and overfitting, and out-of-sample testing such as walk-forward analysis.
Sources
- Backtesting & Simulation, CFA Institute
- Investment model validation brief, CFA Institute Research and Policy Center
- Monte Carlo simulation, AmiBroker documentation
- Monte Carlo Analysis, Jesse documentation
- Strategy Simulation, ML for Trading
Recommended
- MT4 Portfolio Backtesting: Export Replay to Find Real Drawdowns
- Stop Fake Alpha: 5 Checks Quants Need for Hedging Backtesting Data
- Spread Modeling for Backtests: 3 Estimators to Stress Test ML Edge
- Fix Broken Backtests: Automated Strategy Tools with S&P 500 1mo Data
Related resources
Explore BacktestMarket's historical data packs to put the ideas in this article into practice.