

Intraday seasonality is the tendency of volume, volatility and liquidity to repeat the same shape at the same clock times, day after day. The best-documented version is a U: activity peaks near the open and the close and sags in between. Whether any of that is a tradable edge is a separate question, and most of the evidence says it is smaller than it looks. This guide covers what the research shows, where the patterns come from, and how to test them without fooling yourself.
TL;DR
- Volatility, volume and trade counts usually form a U-shaped curve across the session, with the highest activity in the first and last minutes.
- Returns earlier in the day have predicted the final 30 minutes across equities, bonds, commodities and currencies in one large study, but that effect is tied to market structure and can change.
- Patterns are not universal. They differ by asset, by contract maturity, and by exchange rules, so test each market separately.
- Many seasonal periodicities vanish after realistic transaction costs. Use time-of-day effects first to improve execution, then as signals.
- Bad minute bars create fake seasonality. Clean, documented data comes before any time-of-day test.
Table of Contents
- What intraday seasonality actually is
- The U-shape: the pattern you can count on
- Market intraday momentum: the last 30 minutes
- Seasonal patterns are not universal
- Rules change, and so do the patterns
- Why seasonal patterns often fail after costs
- How to measure it properly
- Our perspective
- Data you can test seasonality on
- Putting seasonality to work
- FAQ
- Sources
What intraday seasonality actually is
Seasonality usually brings to mind calendar effects such as January or the summer lull. Intraday seasonality works on a much shorter clock. Slice every trading day into minutes or 5-minute buckets, average a statistic for each bucket across hundreds of days, and plot it against time of day. If the line is not flat, you have an intraday seasonal pattern.
The statistics people usually profile are:
- Absolute or squared returns, a proxy for volatility.
- Volume and number of trades, a proxy for participation.
- Bid-ask spread, a proxy for liquidity cost.
- Signed returns, which is where the trading edge would have to live.
The first three are well established and large. The fourth is weak, unstable and the one retail strategies most often lean on. Keep that distinction in mind through the rest of this article.
The U-shape: the pattern you can count on
In most liquid markets, return volatility, trading volume and the number of trades trace a U across the day, with the highest readings in the first and last minutes. A study of Turkish stock market data documented this, and research on India's National Stock Exchange used tick-by-tick data to examine the same questions of returns, volume and volatility. The shape shows up on both sides of the world, which is why it is treated as a structural feature rather than a quirk of one venue.
Why the open and close are busy
The standard explanation is the theory of concentrated trading from Admati and Pfleiderer. In their model of intraday patterns, liquidity traders and informed traders strategically cluster their activity, which produces high volume and price variability at predictable times. The open follows an extended closure, so information has piled up. The close precedes one, so people want to adjust positions before they cannot.
The analysis of volume at the open and the close points the same way. It models the desire to trade at the start and end of the day as a function of overnight return volatility, and tests it on NYSE data from 1933 to 1988.
What it means for your backtest
The U-shape is not a signal. It is a background condition that changes how every other signal behaves:
- A breakout at 9:35 a.m. New York time happens in a very different volatility regime than the same breakout at 12:30 p.m.
- A fixed 10-pip or 0.2% stop is tight at the open and loose at lunch.
- A volatility filter based on a flat average will switch on and off in a pattern that only reflects the clock.
If your strategy has a fixed rule and trades at several times of day, split your results by hour before you celebrate the total.
Market intraday momentum: the last 30 minutes
The most cited signed-return finding is a different effect. A study of more than 60 futures on equities, bonds, commodities and currencies between 1974 and 2020 found that returns over the rest of the day predict the final half hour. The authors link it to hedging: short gamma exposure has to be hedged by trading in the direction of the price move, which creates momentum into the close.
This is worth taking seriously for two reasons. It has a mechanism, not just a correlation. And it spans asset classes rather than living in one instrument. It is also worth treating carefully. A mechanism rooted in options and ETF hedging depends on how large those positions are, and that has changed over the decades. An effect that was strong in a sample can weaken once enough people trade it.
Seasonal patterns are not universal
A tidy U on a large-cap stock does not transfer automatically to every instrument. Research on Brent crude oil futures, covering 2010 to 2021 tick data, found statistically significant intraday peaks and troughs that depended on the maturity of the contract. Front-month and deferred contracts do not share a single curve. Volume patterns can also differ between liquid and illiquid stocks even where volatility looks U-shaped.
In practice that means:
- Profile each symbol and each contract separately.
- Check whether your instrument trades around the clock (most forex pairs, many futures) or in a defined session. A 24-hour market has several local peaks tied to regional opens, not one U.
- Record the time zone and daylight saving handling of your data. A one-hour offset twice a year smears the pattern in exactly the places you are looking.
Rules change, and so do the patterns
Intraday seasonality is a product of market microstructure. A study of an emerging market examined what happened when a midday single-price call auction and lunch break were replaced with continuous trading, and tracked the effect on intraday volatility and volume patterns. The lesson is simple: when trading hours, auctions or settlement procedures change, a pattern measured before the change tells you little about the one after.
The same applies closer to home. The SEC's market activity report methodology describes the idiosyncrasies of the open and of closing auctions, and why volume metrics need special handling, such as filtering flagged trades and accounting for changing round-lot definitions. If you build minute-level volume profiles from raw exchange data, you inherit those quirks. If your profile has a spike in the last minute, check whether it is a real participation surge or an auction print.
Why seasonal patterns often fail after costs
Finding a periodicity is easy. Keeping it after costs is hard. Brooks and Hinich note that many documented periodicities in returns, volatility, spreads and volume show up in both equity and foreign exchange markets, and propose a test based on signal coherence to detect and quantify them more rigorously than simple linear methods. Their broader point, which echoes across the literature, is that a pattern visible in a chart is not a pattern you can bank.
The reason is usually spreads. The same U that creates the volatility you want also widens spreads and thins the book at the open. A strategy that trades the first five minutes pays more to get in and out than one that trades mid-morning. Our guide to transaction costs for quants covers how to test several cost regimes instead of one flat assumption.
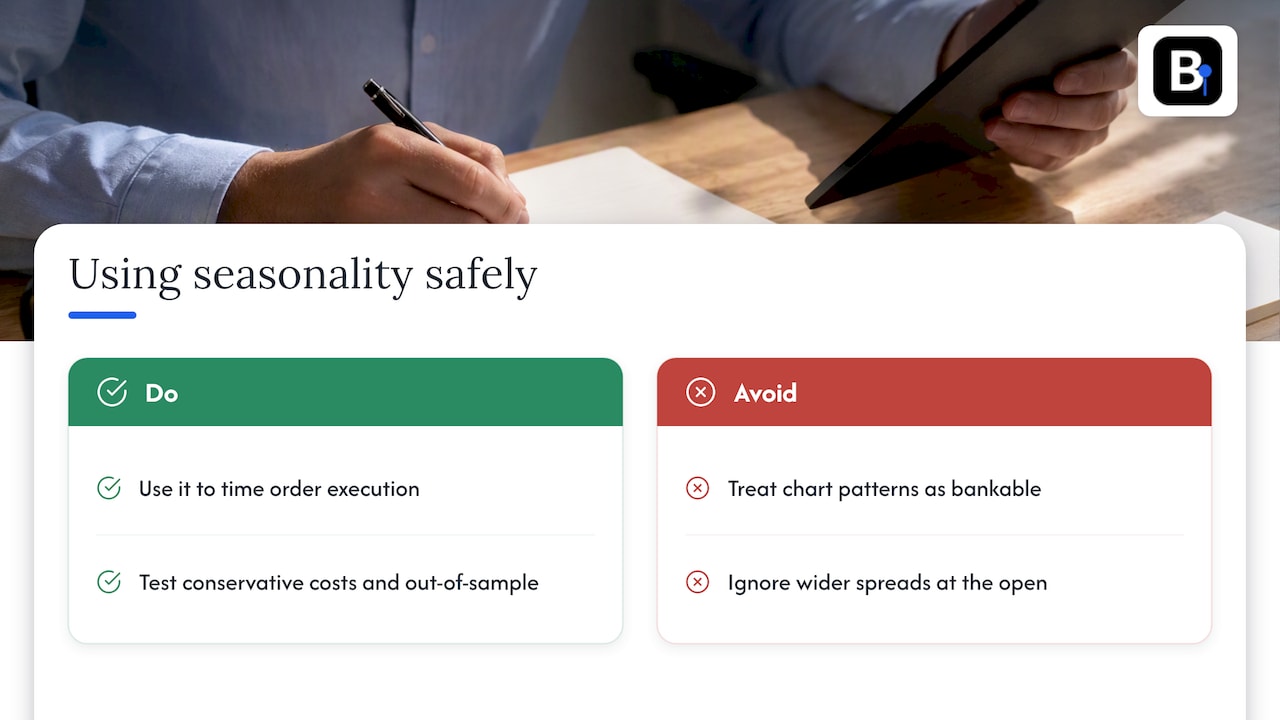
A practical stance follows from this. Use intraday seasonality first for execution: when to work an order, when to avoid crossing the spread, when to scale size. Treat it as a standalone alpha source only after it survives conservative costs and an out-of-sample period.
How to measure it properly
Here is a workflow that keeps the analysis honest.
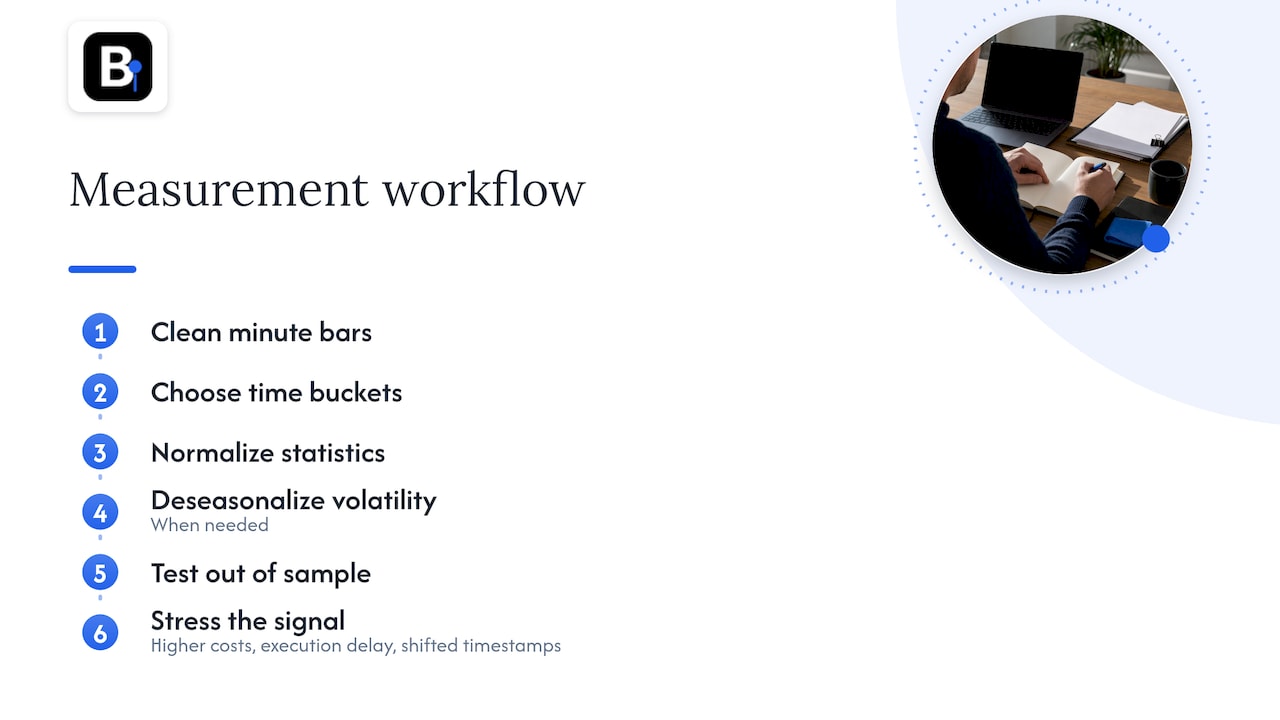
Step 1: Start with clean minute bars
Seasonality estimates average over thousands of bars, so a handful of bad ticks matters less than you might think, but systematic problems matter a lot. Missing minutes cluster around opens and closes. Spikes cluster around news. Time-zone shifts cluster around daylight saving changes. Each one bends the curve at the same time of day, which is precisely how real seasonality looks. We describe a three-condition spike test for removing the worst offenders, and a checklist for auditing intraday data sources before you trust them.
Step 2: Choose your buckets
Five- or 15-minute buckets are a good compromise. One-minute buckets are noisy on thinly traded instruments. Align buckets to the exchange clock, not to your own computer's time zone.
Step 3: Normalize
Compute your statistic for each bucket, then divide by that day's average so a high-volatility day does not swamp a quiet one. Then average across days. Report the median alongside the mean, since a few event days can drag the mean.
Step 4: Deseasonalize when you need clean volatility
Standard realized volatility conflates real price variance with the intraday pattern and with microstructure noise such as bid-ask bounce. Work on index futures applies a Fourier flexible approach to remove the seasonal component before computing volatility, and examines how the distribution of realized volatility behaves under seasonality and noise. If you feed unadjusted volatility into position sizing, your size will follow the clock.
Step 5: Test the signal, not the shape
If you want to trade a signed-return pattern, such as the last-30-minute effect, define the rule before you look: the entry time, the exit time, the instrument, the cost per trade. Then split the sample into at least two periods. If the effect only appears in one, treat it as a story, not a strategy.
Step 6: Stress it
Re-run with doubled costs, with a one-minute execution delay, and with the time stamps shifted by an hour. A real effect should degrade gracefully. A fragile one disappears.
Our perspective
We supply minute-bar data to people who backtest, and the most common intraday seasonality problem we see is not a bad hypothesis. It is bad data wearing the costume of a good one.
A missing session break, a time-zone offset that flips with daylight saving, or an unflagged roll between contracts all produce clean-looking hourly patterns. They are consistent, they repeat, and they look like edge. The backtest then looks excellent, and the live results do not match.
So our standard is boring on purpose. We verify bars one by one, document any adjustment, and keep datasets maintained so they import into MT4 and MT5 without manual repair. Our engineers collect the data and answer support questions themselves, so when a pattern looks odd at 3:00 a.m. in a particular market, you can ask whether it is the market or the data.
Our rule of thumb for seasonal work: check the data before the idea, check costs before the returns, and check a second period before you trust either.
— Start
Data you can test seasonality on
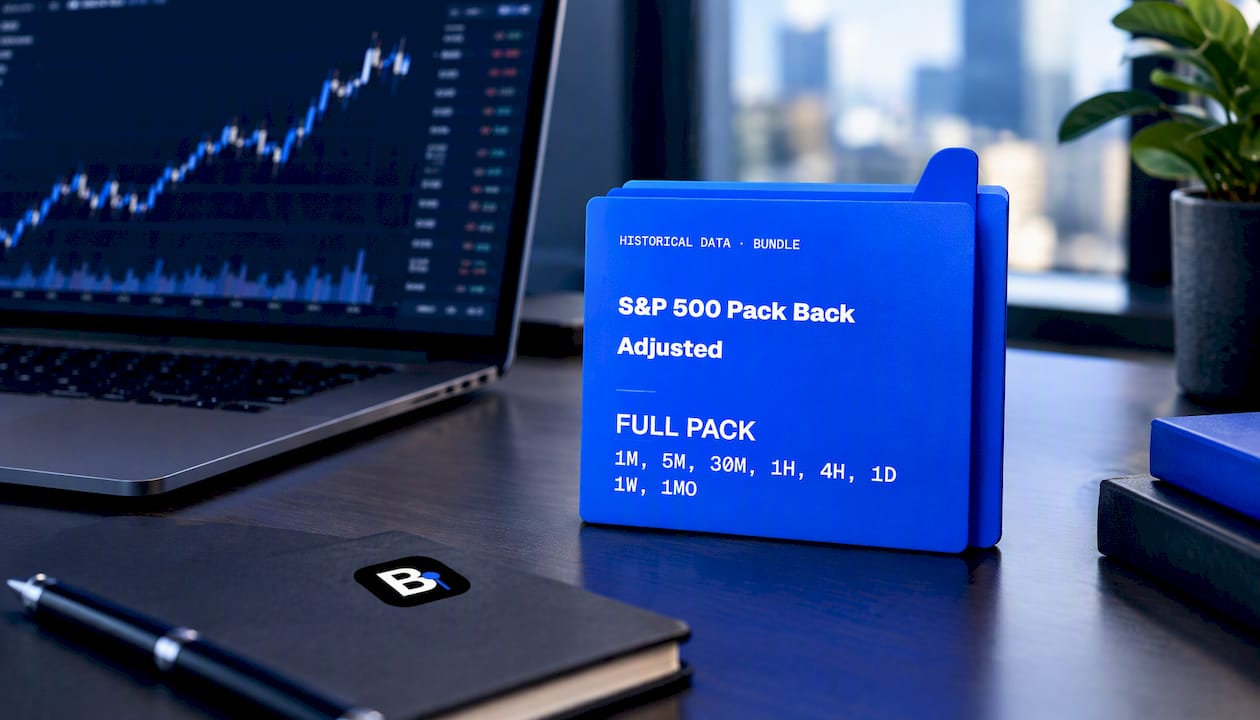
Intraday seasonality needs many years of consistent minute data, with the same time convention throughout. Our Historical Data page covers forex, metals, stock indices and bonds from 2014, as one-time downloads ready to import into MT4 and MT5. If you test across many symbols, our Annual Plan is listed at €119 per year. For index futures work, the S&P 500 Pack Back Adjusted removes contract-roll gaps that would otherwise create artificial overnight and open-of-day effects.
Putting seasonality to work
A few applications that hold up better than the standalone "buy at X, sell at Y" rule:
- Execution timing. Avoid crossing wide spreads in the opening minutes unless your signal is strong enough to pay for it.
- Volatility-aware stops. Scale stop distance by the expected volatility for that time of day, not by a daily average.
- Session filters. Disable mean-reversion logic during high-volatility windows, or breakout logic during dead ones, and test whether the filter helps out of sample.
- Correlation checks. Relationships between instruments change by hour. See our note on intraday correlation data for why a daily figure can hide mid-session breaks.
- Multi-symbol portfolios. If each symbol has a different curve, aggregated results can mislead. Our piece on multi-symbol backtesting shows how to test two symbols first.
For broader strategy ideas that use session structure, see our overview of day trading strategies.
FAQ
Is intraday seasonality the same as the U-shaped volatility pattern?
The U-shape is the best-known intraday seasonal pattern, but not the only one. Volume, spreads, trade counts and, more weakly, signed returns can all show time-of-day regularities. Some markets, particularly 24-hour ones, show several peaks rather than one U.
Can you profit from intraday seasonality?
Sometimes, but less often than charts suggest. Research on periodicities warns that many fail to stay profitable after realistic transaction costs. The more reliable use is execution and risk sizing. Any signed-return strategy needs out-of-sample testing and conservative cost assumptions.
How much data do I need to measure it?
There is no fixed number, but you need enough days that averages per bucket stabilize and enough years to cover different regimes, such as calm and stressed markets. Splitting the sample into separate periods is the practical test: if the pattern holds in both, it is more credible.
Do intraday patterns stay the same over time?
No. They depend on market rules such as auctions, trading hours and settlement. Research on an emerging market showed that replacing a midday call auction with continuous trading changed volatility and volume patterns. Re-measure after any structural change.
Sources
- Intra-day seasonalities on stock returns: evidence from the Turkish Stock Market
- Intraday Variability and Trading Volume: Evidence from National Stock Exchange
- A Theory of Intraday Patterns: Volume and Price Variability
- Trading Halts and Market Activity: An Analysis of Volume at the Open and the Close
- Hedging demand and market intraday momentum
- Intra-day seasonality and abnormal returns in the Brent crude oil futures market
- Intraday analysis of regulation change in microstructure: evidence from an emerging market
- SEC Market Activity Report Methodology
- Detecting Intraday Periodicities with Application to High Frequency Exchange Rates
- The distribution of index futures realised volatility under seasonality and microstructure noise
Recommended
- Quants: Intraday Data Cleaning With a Three Condition Spike Test
- Avoid Blind Spots by 3 PM: Engineered Intraday Correlation for Quants
- Prevent Broken Backtests: Intraday Data Sources Practitioners Must Audit
- Top Day Trading Strategies: A Complete Guide
Related resources
Explore BacktestMarket's Expert Advisor robots to put the ideas in this article into practice.