

Continuous futures data is a single, unbroken price series stitched together from a chain of expiring futures contracts. You need it because no single contract lives long enough to backtest a strategy over years. The catch is that every stitch involves two choices, when to roll and how to adjust prices at the join, and those choices can change your backtest results as much as the strategy itself.
This guide shows how continuous series are built, which method fits which kind of strategy, and what to check before you trust a dataset.
TL;DR
- A continuous series splices expiring contracts using a roll calendar and an adjustment method, so you avoid artificial price gaps at every roll.
- There is no single best method. Match the roll rule and the adjustment (ratio or difference) to what your strategy measures.
- Keep two versions: an adjusted series for signals and a raw series for realistic profit and loss.
- Check the roll dates, the adjustment documentation and bar-level integrity before you run a single test.
- Our Historical Data sets are clean minute bars, built for direct import into MT4 and MT5.
Table of Contents
- Why a single futures contract is not enough
- Step one: choose a roll rule
- Step two: choose an adjustment method
- Why your choice can change the result
- Raw and adjusted: keep both
- What clean continuous data looks like
- Matching the series to the strategy
- Our perspective
- Where our data fits
- A short pre-test checklist
- FAQ
- Sources
Why a single futures contract is not enough
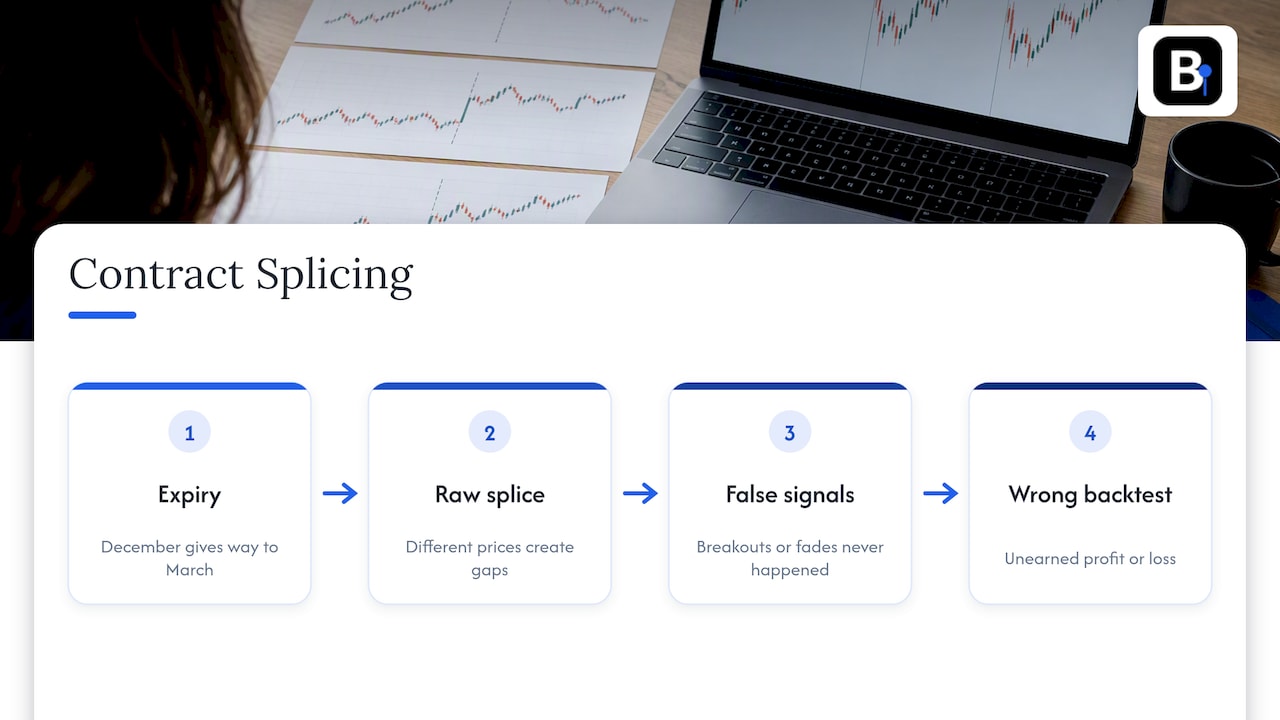
Futures contracts expire. A December contract stops trading in December and the March contract takes over. If you simply glue the raw contract histories together, you get artificial price gaps at every roll, because the two contracts trade at different prices for the same underlying market.
A strategy cannot tell a roll gap from a real move. A trend follower sees a breakout that never happened. A mean-reversion system sees a gap to fade. The backtest then reports profit or loss that nobody could have earned. A 2020 paper on backtesting methodology makes the same point: if contracts are spliced naively, the resulting backtest is wrong.
Continuous data fixes this by joining contracts according to explicit rules. CME Group publishes its own continuous price series built on the Active Contract (the most liquid) or the Front Contract (the nearest to expiry), updated from settlement prices. Those are daily, settlement-based series. If you test intraday logic, you need minute bars built on the same principles.
Step one: choose a roll rule
The roll rule decides the day your series switches from the expiring contract to the next one. Following a predefined roll schedule, for example two business days before expiry, keeps the series reproducible.
The Quantpedia summary of the Vojtko and Padyšák paper lists the common options:
| Roll rule | How it works | Main trade-off |
|---|---|---|
| Last trading day | Hold the expiring contract until it stops trading | Longest use of the front month, but liquidity may have moved to the next contract well before |
| First of delivery month | Roll on the first day of the delivery month | Predictable and easy to execute, but not tied to actual trading activity |
| Liquidity-based | Roll when the next contract's open interest or volume overtakes | Closer to where traders really are, but needs good volume data |
The same research warns that automated rules such as first-of-month or nearest-contract may not match historical liquidity patterns. Real roll behavior also differs by market. For E-mini S&P 500 futures, which expire in March, June, September and December, one roll calendar for 2026 puts the active roll on the Thursday eight calendar days before the last trading day. A crude monthly rule would miss that. A crude quarterly rule tuned to equity indices would be wrong for metals or energy, which have different expiry cycles.
For a deeper look at roll mechanics, see our posts on rolling rules for futures contracts and futures rollover methods that cut roll drag.
Smooth rolls versus single-day switches
Some series switch on one day. Others blend. For high-liquidity markets, exchanges often calculate rolling indices that transition weights over several days to follow the liquidity profile. A blended roll is useful for index-style performance tracking. For a trading backtest that must enter and exit at real prices, a single-day switch on a known date is easier to reason about, because every bar belongs to one actual contract.
Step two: choose an adjustment method
Once you know the roll dates, you still have a gap on each of them. Back-adjustment shifts all earlier prices so the series is smooth at the join. There are two main approaches.
Difference (additive) adjustment. Add or subtract the roll gap in points from every earlier price. Point-based logic stays intact: a 10-point stop is a 10-point stop in 2015 and today. The downside is that old prices can drift far from their true level, and even go negative over long histories in some markets.
Ratio (multiplicative) adjustment. Scale earlier prices by the ratio of the two contracts at the roll. Percentage returns stay correct. The downside is that point distances in the past no longer match what you would have seen on screen.
Practitioners often use difference-based adjustment for systematic backtests to keep point-based logic intact, and ratio adjustment for percentage-return strategies. The authors themselves note there is no single best approach, and that a first-of-month roll with backward ratio adjustment suits strategies where percentage performance is the main metric.
A worked example
Suppose the expiring December contract closes at 5,000.00 on roll day and the March contract closes at 5,040.00.
- Difference: every December price before the roll is shifted up by 40 points. A bar that printed 4,900.00 becomes 4,940.00.
- Ratio: every earlier price is multiplied by 5,040 / 5,000 = 1.008. The same 4,900.00 bar becomes 4,939.20.
The numbers differ by under a point here. Over fifty rolls in a market that stays in contango, the cumulative gap grows, and the two series diverge visibly. Difference-based adjustments can drift significantly with the market's carry structure, contango or backwardation, which can distort strategy signals.
Why your choice can change the result
This is not a cosmetic detail. In his machine learning case study on CME futures, Stefan Jansen shows that preprocessing choices such as the back-adjustment method can affect results more than model selection. The same model and features can show positive signal performance under one method and negative under another.
The practical lesson: when a strategy looks great on one series, rebuild it on another adjustment before you believe it. If the edge disappears, it was probably an artifact of the data.
Raw and adjusted: keep both
Adjusted prices are what you feed to indicators and signal models. They are not what you would have paid. Practitioners in the R-SIG-Finance community noted that adjusted series are essential for testing signals, but they can drift in ways that economically meaningless price changes do not. So many keep a raw, unadjusted series for profit and loss logic and an adjusted series for signal generation.
In practice that means:
- Generate signals on the back-adjusted series.
- Fill orders and compute P&L against the raw prices of the contract you would actually have held.
- Treat each roll as a real trade with real cost: a close on the old contract and an open on the new one.
The same separation matters when you are testing alert-driven or indicator-based systems. If you use a signal tool, ask which price series it reads and whether realistic P&L is calculated on unadjusted contract prices. This overview of futures signals and Discord alert workflows is a useful companion when you are deciding how signals should connect to execution.
What clean continuous data looks like
Before you test anything, run a short audit on your data. A good continuous dataset should let you answer yes to each of these.
- Are the roll dates published? You should be able to list every roll and the rule behind it.
- Is the adjustment documented? Method (ratio or difference), direction (backward), and the size of each adjustment.
- Is a raw version available? Without it, P&L logic is guesswork.
- Are bars verified? Spikes, zero-volume bars and duplicated timestamps can pass unnoticed. Our three-condition spike test shows one way to flag bad minute bars.
- Is the history stable? If a vendor silently revises past data, yesterday's results will not reproduce. We cover this in tracking historical data updates.
For a plain-language introduction, our post What is continuous futures data and back-adjustment covers the basics step by step.
Matching the series to the strategy
| Strategy type | Suggested starting point | Reason |
|---|---|---|
| Trend following on percentage returns | Ratio back-adjusted, liquidity-aware roll | Returns stay proportional across decades |
| Fixed-point stops and targets | Difference back-adjusted | Point distances remain true |
| Spread or calendar logic | Individual raw contracts | A continuous series hides the spread you are trading |
| Intraday systems | Minute bars with documented roll dates | Gaps at rolls otherwise trigger false signals |
| Multi-market portfolios | Same method across all markets | Keeps results comparable; see multi-symbol backtesting |
This table is a starting point, not a rule. Test at least two methods for any strategy you intend to trade with real money.
Our perspective
We collect and maintain our data sets as engineers, and we see the same failure again and again: a trader spends weeks refining a strategy, then discovers that the data hid a roll gap, a bad bar or an undocumented adjustment. Model tuning cannot repair that.
Our view is simple. The data should be clean before it reaches your platform, every adjustment should be documented, and a dataset should import into MT4 or MT5 without a cleaning project. That standard applies whether a human reads the equity curve or an AI model is trained on the bars. When a result looks too good, we recommend testing it on a second adjustment method and on raw prices before committing capital.
— Start
Where our data fits
BacktestMarket sells one-time downloads of complete minute-bar historical intraday data from 2014, covering forex, metals, stock indices, bonds and commodities, ready to import into MT4 and MT5. The range includes bundles by asset class and back-adjusted futures data. You can browse everything on the Historical Data page, or get the full set in the Historical Data Complete Pack.
If you want ongoing access, the Annual Plan costs €119 per year. We also offer expert advisors and indicators on our main site, and our post on automated strategy management tools shows how to use them in a portfolio.
A short pre-test checklist
- Write down your roll rule and why it suits the market's liquidity.
- Pick ratio or difference adjustment based on whether your logic uses percentages or points.
- Store a raw series alongside the adjusted one.
- Scan minute bars for spikes, gaps and duplicate timestamps.
- Run the strategy on a second method. Compare, and treat large differences as a warning.
- Add roll costs (spread and commission on both legs) to every roll.
If you test hedged or multi-leg ideas, the five checks for hedging backtesting data add a few more points worth reviewing.
FAQ
What is the difference between continuous futures data and a futures data feed?
A data feed delivers live or delayed quotes from exchanges as they trade. Continuous futures data is a historical series built from many contracts so you can analyze long periods as one line. You use a feed to trade today and a continuous series to test what you would have done before.
Which is better, ratio or difference adjustment?
Neither wins in every case. Research on continuous contracts finds that each algorithm has trade-offs and that the choice should follow your objective. Ratio suits percentage-based strategies, and difference suits point-based logic.
Can I backtest on a continuous series and trade the same results live?
Not exactly. Adjusted prices are not real traded prices, so use them for signals and use raw contract prices for P&L. Also include roll costs, because live trading pays spread and commission each time you move to the next contract.
How far back should long-term futures trend tests go?
As far as the data is reliable and relevant to current market structure. A longer history gives more regimes but more rolls and more cumulative adjustment. Our minute-bar sets start in 2014, which gives you a decade-plus of intraday behavior to test.
Sources
- CME Group Continuous Price Series
- Continuous Futures Contracts Methodology for Backtesting (SSRN)
- Continuous Futures Contracts Methodology for Backtesting (Quantpedia)
- ML for Trading: CME futures case study
- R-SIG-Finance: Generic versus calendar futures in trading models
- Continuous Futures Data (Strateda)
- E-mini S&P 500 roll dates 2026
Recommended
- What is Continuous Futures Data and Back-Adjustment
- Market Data Formats for Developers & Quants: SBE, Parquet, Dollar Bars
- Quants: Intraday Data Cleaning With a Three Condition Spike Test
Related resources
Explore BacktestMarket's Expert Advisor robots to put the ideas in this article into practice.