

Survivorship bias in backtesting happens when your historical test universe contains only the instruments that are still around today. The failures (delisted, bankrupt, merged or dropped from an index) are missing, so your strategy never has to lose money on them. The result is a backtest that looks better than any live account could have done. The fix is a dataset that reflects what was actually tradable on each historical date, plus a few tests that prove it.
TL;DR
- Survivorship bias means testing on a universe pre-filtered by the outcome "still exists today". It inflates returns and Sharpe ratios and can even create anomalies that never existed.
- The damage is measurable: a 2026 study of India's NIFTY Smallcap 250 found annual returns overstated by 4.94 percentage points in survivor-only backtests.
- Adding a few delisted tickers is not enough. You need membership history, delisting returns, corporate actions and liquidity filters applied day by day.
- Not every market has the problem in the same form. Continuous instruments such as forex pairs, metals and index series carry different risks: gaps, bad ticks and undocumented adjustments.
- Before you trust any result, run the checks in the checklist below, and keep a raw copy of the data you can audit.
Table of Contents
- What survivorship bias is, in plain terms
- A simple example you can reproduce
- How much does it actually distort results?
- Who is most exposed
- Related biases that travel with it
- How to test a backtest for survivorship bias
- What a clean universe really requires
- Survivorship bias outside stocks
- Our perspective
- Choosing data that will not flatter you
- Where our data fits
- A short pre-flight checklist
- FAQ
- Sources
What survivorship bias is, in plain terms
Survivorship bias is a form of selection bias. As one data-analysis primer puts it, it is the habit of drawing conclusions from what survived a selection process while ignoring what did not. In backtesting, the selection process is time itself. A stock that was listed in 2012 and went bankrupt in 2016 will not appear in a list of today's index members, so a test built from that list never owns it.
The subtle danger is the conclusion you draw. You see a strategy that earned a steady return and assume the rules were good. In fact the universe was cleaned of the losers that every real strategy would have had to hold at some point. The edge belongs to the data, not to the logic.
A simple example you can reproduce
Take the question "would buying cheap, beaten-down stocks have worked over the last 15 years?" You pull today's list of S&P 500 members, rank them by how far they fell in a given year, and buy the worst decile. Every stock on that list recovered enough, or grew enough, to be in the index now. The ones that kept falling until they were removed are not on your list. Your "buy the losers" strategy has quietly become "buy the losers that later turned out fine".
A second, closely related error is the mirror image: companies added to an index in 2015 get included in a test running from 2000 to 2010. They were not index members then, and part of the reason they joined is that they had already done well. A practitioner write-up on reconstructing S&P 500 membership uses exactly this case, along with firms like Lehman Brothers and Enron that dropped out of the index after failing.
How much does it actually distort results?
The size of the effect depends on the market, the holding period and the strategy. Three data points from published work give a feel for the range.
| Evidence | What it found |
|---|---|
| NIFTY Smallcap 250 study (2016 to 2025) | Survivor-only backtests overstated annual returns by 4.94 percentage points (about 23.3% in relative terms) and lifted the Sharpe ratio by 0.097. The study covered 1,437 stocks and saw an 82.5% index removal rate. |
| Delisting bias in CRSP Nasdaq data | Missing returns for delisted stocks were large and negative on average, and correcting them changed how the size effect looked in Nasdaq data. |
| Industry estimate on time-series fidelity | Ignoring delisted issuers can inflate multi-year simulated returns by roughly 1.5% a year, compounding over time. |
Treat the last figure as a rough industry rule of thumb, not a constant. The small-cap result shows that in a churn-heavy universe the error can be several times larger.
Why delistings hurt more than you would guess
When a stock leaves an exchange, the last price in many databases is not what an investor actually received. In his study of the CRSP database, Tyler Shumway documented that delistings for bankruptcy and other negative reasons are generally surprises, and that the correct delisting returns are far worse than a missing value implies. The later research on Nasdaq data also found that delisted stocks suffered a substantial drop in liquidity. In other words, you could not have sold at a clean price even if the data showed one.
That is why a missing delisting return is not a neutral gap. It silently converts a large loss into no loss at all.
Who is most exposed
Survivorship bias is asymmetric. Per published guidance from academic quant material, it hits hardest in strategies that hold positions for long periods and in smaller, more volatile or distressed names, where delisting rates are naturally higher. A one-day-holding strategy on mega-cap liquid names is far less affected than a multi-year value screen on small caps.
Another angle is fund and holdings data. As one analysis of 13F filings explains, closed, merged and shrunken funds stop filing, so any dataset built from today's filers loses them. If you study manager behavior, the same logic applies.
Related biases that travel with it
Survivorship bias rarely arrives alone. Three neighbors are worth keeping apart:
- Look-ahead bias. Using information that was not available at the simulated trade date. A common source is restated financials: point-in-time data guidance points out that the figure you have today may not be the one originally filed.
- Data-snooping bias. Trying many variants on the same dataset until one looks good.
- Unrealistic investability. Including names that were untradable, or too illiquid, on the simulated date.
A fix for one often exposes another. Rebuilding membership history, for example, solves survivorship bias and look-ahead bias in index composition at once.
How to test a backtest for survivorship bias
You do not need a perfect database to start detecting the problem. Work through these steps in order.
- Ask what the universe was on the first test date. If the answer is "today's list", you have a problem. The universe should be rebuilt as of each date.
- Count the dead. Over a 10-year window, a universe of any size should contain names that no longer exist. If none do, the data is survivor-only.
- Look for famous failures. Search for tickers of well-known bankruptcies and acquisitions in your period. Their absence is a quick tell.
- Check what happens at delisting. Does the data carry a final return, or does the price series just stop? A series that stops means the loss is missing.
- Rerun on a narrowed, honest universe. Compare results between survivors-only and a point-in-time set. The gap is your estimate of the bias.
- Stress the result. If a small tweak, like dropping the bottom 10% by liquidity, changes the answer dramatically, the edge is probably an artifact.
What a clean universe really requires
Point-in-time membership
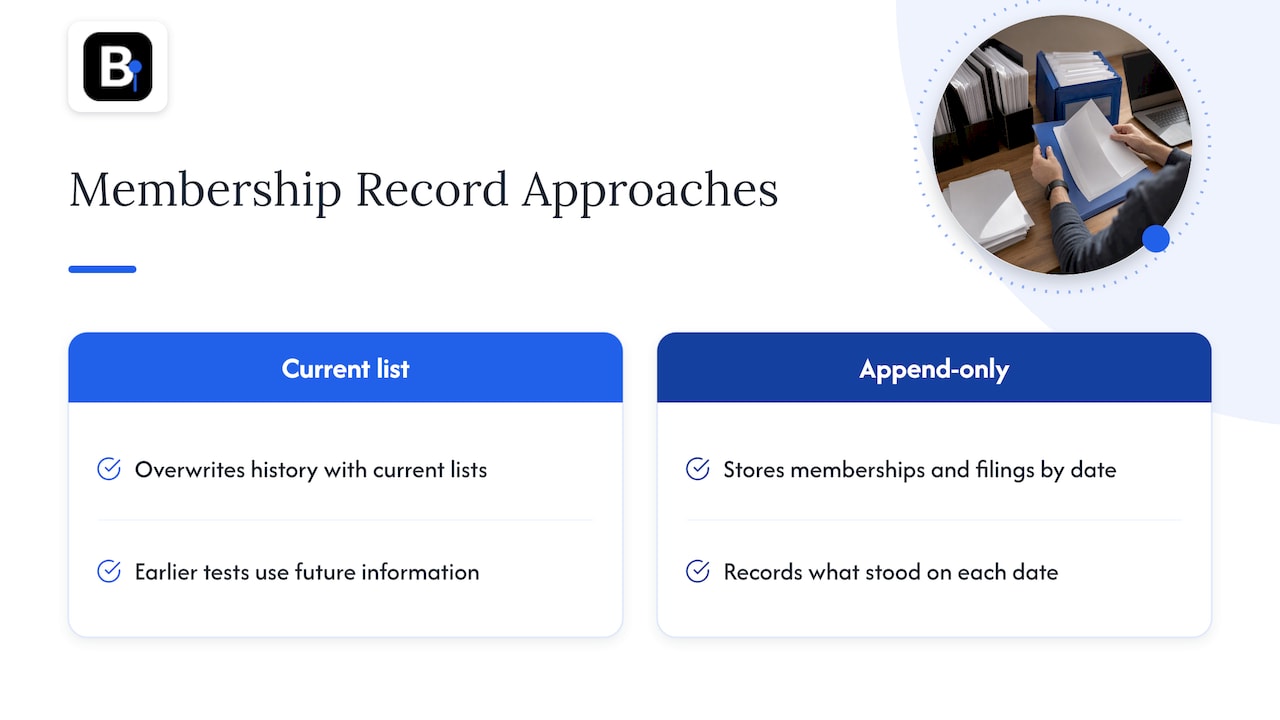
The sturdiest approach, according to Arkolith's description of point-in-time design, is an append-only database that stores index memberships and filings as they stood on each date, instead of overwriting history with current lists. Without that, your simulation will use information the market did not have yet.
Liquidity filters, applied daily
Apply minimum price and minimum average daily volume to the candidate pool for every historical day, not to today's survivors. The same academic material warns that a universe containing bankrupt or untradable companies creates an "unrealistically investable" bias in the other direction.
Corporate actions on defunct names
Adding delisted tickers is a shallow check by itself. You also need to confirm how splits, spinoffs and mergers were handled for those entities. Experienced developers keep their own corporate action calendar and a raw, unadjusted copy of prices next to a documented adjustment method, as this fidelity guide recommends. Do not treat a vendor's adjusted close as the sole truth.
Survivorship bias outside stocks
If you trade forex, metals, bonds or index CFDs, the classic version of the problem is smaller. A EUR/USD series does not delist. But you can still face the same underlying flaw: a dataset shaped by what someone chose to keep. In continuous markets it shows up as:
- Selective histories: vendors dropping symbols, brokers retiring instruments, or a test limited to the pairs that behaved well.
- Silent revisions: history that changes when a vendor updates a feed, so last month's backtest cannot be reproduced. We cover why in our piece on tracking historical data updates.
- Undocumented adjustments: back-adjusted futures series where nobody wrote down how rolls were handled.
- Gaps and bad ticks: missing minutes or spikes that flatter or punish a strategy.
The same discipline applies: know what is in the data, what was removed and why.
Our perspective
We sell minute-bar historical data, and most of the traders who write to us are not asking about delisted stocks. They ask why their MT4 or MT5 result will not match a colleague's, or why a strategy that looked great last quarter looks ordinary after a data refresh. The root cause is the same family of problem: the dataset was quietly shaped before the test began.
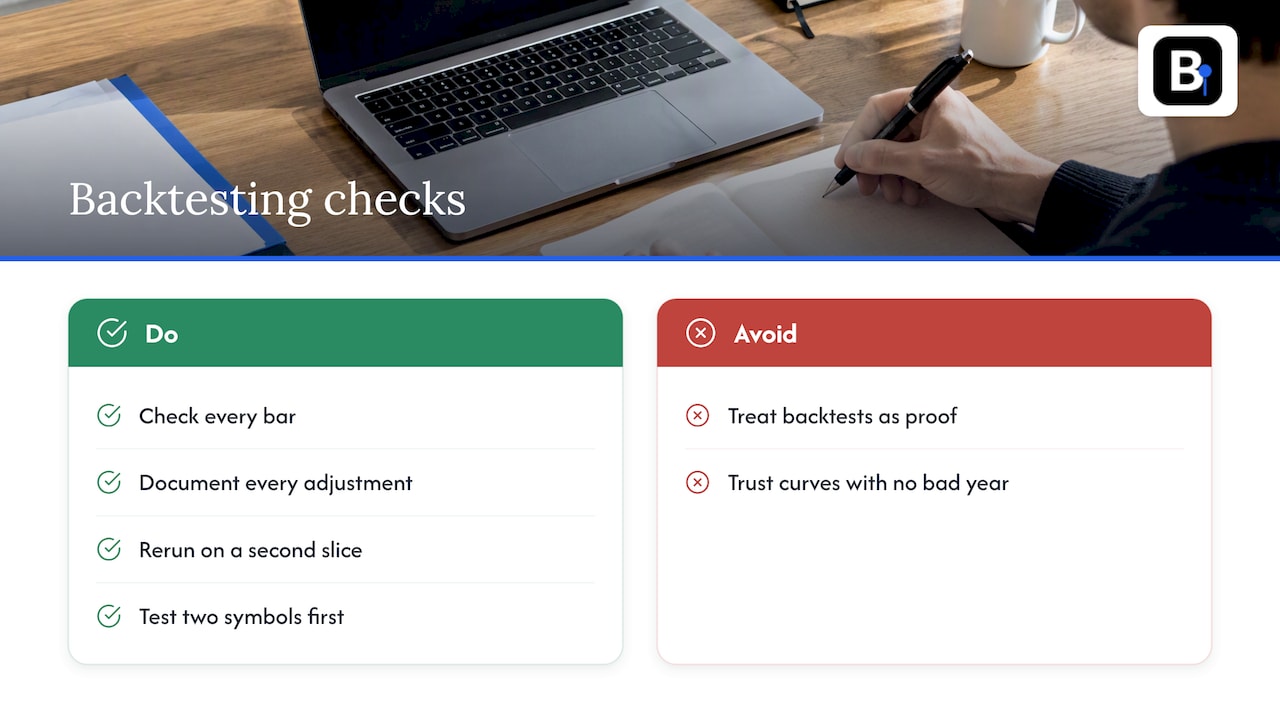
Our standard is simple to state. Every bar should be checked, every adjustment should be documented, and the dataset should be ready to import without a cleanup project. We maintain our datasets so they stay compatible with MT4 and MT5, and the engineers who collect the data are the people who answer your questions. When you ask us how a gap was handled, you get an answer from someone who looked at the bar.
We also hold a firm view on testing. A backtest is evidence, not proof. Run it on clean data, rerun it on a second slice, and be suspicious of any equity curve that never has a bad year. If you are running several symbols at once, test two first and then check engine costs, as we explain in our multi-symbol backtesting guide. For the integrity side, our five checks for hedging backtests is a good companion.
— Start
Choosing data that will not flatter you
When you evaluate any data source, put these questions to it in writing:
| Question | A good answer sounds like |
|---|---|
| What was the universe on each date? | A dated membership history, not a current list |
| What happens to a series at the end of its life? | A recorded final value or documented treatment |
| Are adjustments documented? | A written method, with raw data available |
| Does history change after release? | Versioned updates with a changelog |
| Who answers technical questions? | People who collect and maintain the data |
A data vendor that cannot answer these is selling you a number, not a record. For a longer look at price versus value in this market, see our breakdown of what historical market data costs and when to buy once.
A note on mean reversion
Mean reversion strategies are especially sensitive to this bias, because they buy things that have fallen and bet on recovery. If the fallen names that never recovered are missing, the strategy looks brilliant. When you test such ideas, read about testing mean reversion strategies safely and then check the universe before you trust the curve.
Where our data fits
Our Historical Data page covers clean minute-bar intraday sets since 2014 across forex, metals, bonds and stock indices, delivered as a complete download that imports directly into MT4 and MT5. If you want to test equity ideas, the Most Traded Stocks pack is the place to start. And if you want ongoing access, the Annual Plan is €119 per year.
We do not claim that any one dataset cures every bias. What we promise is documented, verified data and engineers who explain how it was built.

A short pre-flight checklist
Before you commit capital to a backtested strategy, confirm each of these:
- The universe was rebuilt as of each test date.
- Delisted, merged and removed instruments are included, with their final returns.
- Liquidity and price filters are applied historically, not to survivors.
- A raw copy of the data exists, with adjustments written down.
- The data version is fixed, so the test can be reproduced.
- Results hold on a second period and a second set of symbols.
- The Sharpe ratio is checked against a survivor-only run, so you know how much of it is bias.
If you replay a portfolio in MT4, also look at how drawdowns appear when you export the replay, as in our guide to MT4 portfolio backtesting.
FAQ
What is reverse survivorship bias?
It is the opposite distortion: drawing conclusions from the failures alone, or treating the survivors as luckier than they were. In trading it shows up when you study only blown-up accounts or failed strategies and conclude that a practice is always harmful. Both directions come from the same mistake of looking at a filtered sample.
What are examples of survivorship bias in trading?
Testing on today's S&P 500 members across a 20-year window is the classic one. Others include studying only funds that still report, and building a small-cap screen from a current index list. The NIFTY Smallcap 250 study is a measured example, with annual returns overstated by 4.94 percentage points.
Does survivorship bias affect forex backtests?
Not in the delisting sense, since major currency pairs do not disappear. It still matters if you pick only the pairs or periods that worked, or if your data provider revises or drops history. Documented, stable, verified minute data is the protection there.
Can I fix survivorship bias just by adding delisted stocks?
No. That is a shallow check. You also need accurate membership dates, delisting returns, correct handling of corporate actions on defunct companies, and liquidity filters applied for each historical day.
Sources
- Survivorship bias in India's NIFTY Smallcap 250 (arXiv)
- The Delisting Bias in CRSP's Nasdaq Data and Its Implications for the Size Effect (EconPapers)
- The Delisting Bias in CRSP Data (Shumway)
- Time-Series Fidelity in Synthetic Wealth Data (WealthSchema)
- How Survivorship Bias Affects your Analysis (Data School)
- Does Trend Following Work on Stocks? (University of Pennsylvania)
- Arkolith
- Point-in-Time Data: Essential for Backtesting (StockFit)
- Survivorship Bias: Revealing the Hidden Truths of the S&P 500 (Medium)
Recommended
- Stop Fake Alpha: 5 Checks Quants Need for Hedging Backtesting Data
- Protect Your Backtest: 5-Step Audit for Handling Missing Bars
- Data Snooping Bias: How Researchers and Quants Catch It
- What Is Walk Forward Analysis and Good Practices While Backtesting
Related resources
Explore BacktestMarket's historical data packs to put the ideas in this article into practice.