Tick data records every individual trade or quote update. Minute data compresses all of that activity into one open, high, low, close and volume row per minute. Tick data keeps the full price path and costs far more to store and process. Minute bars keep the shape of each minute and are far easier to clean, verify and run. Most intraday strategies that trade on a timescale of minutes or longer can be tested well on clean minute bars. Strategies whose edge lives inside the minute need ticks.
This guide explains what each format contains, what aggregation destroys, how to build minute bars from ticks without corrupting them, and how to choose.
TL;DR
- Tick data is an event log: one row per trade or quote change, with a timestamp. Minute data is a summary: one OHLCV row per minute.
- Aggregating ticks into minute bars discards the intra-minute price path: reversals, microstructure events and partial fills.
- Use ticks for execution research, market making and high-frequency logic. Use minute bars for technical, intraday and medium-frequency systematic models.
- Bad timestamps and session boundaries distort both formats. A clean minute set beats a messy tick set.
- Test one strategy on both before paying for the heavier format.
Table of Contents
- What tick data and minute data actually are
- Side-by-side comparison
- What you lose when ticks become minute bars
- When tick data is worth the cost
- When minute bars are enough, and often better
- Time bars versus tick bars
- How to build minute bars from ticks without corrupting them
- Data quality decides the result more than granularity
- Our perspective
- Where our minute data fits
- A practical decision rule
- FAQ
- Sources
What tick data and minute data actually are
A tick is a single market event. Depending on the feed, it is a trade (price and size) or a quote update (new bid or ask, with sizes). Each row has a timestamp, often to the millisecond or finer. Ticks arrive irregularly: dozens in one second during a news release, none for a minute in a quiet Asian session.
A minute bar is a fixed-interval summary of those events. For every minute it stores:
- Open: the first price in the interval
- High: the highest price
- Low: the lowest price
- Close: the last price
- Volume: a measure of activity in the interval
That structure is called OHLCV. It is the native format of MetaTrader 4 and 5 history, and of most charting and backtesting tools.
The key difference is the sampling rule. Tick data is sampled by events: something happened, so a row exists. Minute data is sampled by the clock: a minute passed, so a row exists. That one difference drives everything below.
Side-by-side comparison
| Feature | Tick data | Minute bars (OHLCV) |
|---|---|---|
| What a row is | One trade or quote update | One minute of activity |
| Timestamps | Irregular, very fine | Regular, one per minute |
| Price path inside the minute | Fully preserved | Reduced to four numbers |
| Bid/ask detail | Available in quote feeds | Usually one price series, sometimes with a spread field |
| File size | Very large, can reach millions of records a day in liquid markets | Small: at most 1,440 rows per 24-hour day |
| Cleaning effort | High: outliers, duplicates, out-of-order events | Moderate: gaps, weekends, session edges |
| Backtest speed | Slow | Fast |
| Best for | Execution, market making, microstructure | Intraday, technical and systematic strategies |
One small difference matters in practice: volume. A frequency-controlled academic comparison notes that minute OHLCV approximates dollar volume as close price times minute volume, while tick data sums price times quantity trade by trade. The bar figure is an approximation; the tick figure is exact. If you build volume-weighted features, that gap can show up in your results.
What you lose when ticks become minute bars
Every bar hides a story. Take two minutes that both open at 1.0850, high at 1.0860, low at 1.0840 and close at 1.0855. In the first, price drifted down to the low, then rallied. In the second, it spiked to the high, collapsed through the low, then recovered. The OHLC rows are identical. The trades you could have taken are not.
Aggregation discards the intra-minute price path, including reversals, microstructure events and partial fills. In practice, that creates four recurring problems:
- Stop and target order ambiguity. If a bar's range contains both your stop and your target, the bar cannot tell you which was hit first. Backtesters guess, usually with a fixed rule such as assuming the worst case.
- Hidden spread widening. A one-price series cannot show the moment the spread blew out for two seconds around an event.
- Unobservable fills. You cannot tell whether a limit order resting at the low would have filled, or how much size traded there.
- Smoothed volatility. Bars compress bursts of activity into the same four numbers as quiet periods. The same study argues that calendar-based bars map uneven market activity onto an even grid, which introduces statistical distortions.
These are real limits, but they are limits of resolution, not of quality. They matter in proportion to how close your holding period is to the length of a bar. A strategy that holds for four hours and targets 60 pips has little to fear from the order of events inside one minute. A scalper aiming for 1.5 pips has a lot to fear.
If you are unsure whether your chosen bar length is hiding structure, our guide on running a signature plot on 1 minute and 5 minute bars shows a quick diagnostic.
When tick data is worth the cost
One overview of OHLCV, tick and Level 2 data describes tick data as the right fit for high-frequency trading, market making, execution algorithms and microstructure research. That matches how practitioners usually split the choice. Reach for ticks when:
- Your expected profit per trade is similar in size to the spread or to typical slippage.
- Your logic reacts to individual quote changes, order flow imbalance or trade size.
- You are modeling your own execution: queue position, partial fills, latency.
- You need to resolve which side of a bar's range was touched first, repeatedly and at scale.
- You are studying microstructure itself, such as spread dynamics around releases.
Be realistic about the cost. Tick files for liquid instruments grow quickly, backtests take much longer, and the data is harder to validate. A feed with duplicate prints, stale quotes or out-of-order timestamps can quietly produce a beautiful equity curve that no live account could reproduce. Ticks give you more truth only when the data is clean enough to hold it.
There is also a structural point. Forex is decentralized, so a tick history from one source reflects that source's quotes, not a single consolidated tape. Two tick sets for the same pair can differ in a way two clean minute sets mostly do not.
When minute bars are enough, and often better
The same overview calls minute bars more manageable for intraday strategies, technical analysis and medium-frequency systematic models, but too coarse for some execution questions. Our experience as a data provider agrees with the first half of that. Minute bars are the right default when:
- Your signals come from indicators, ranges, breakouts, or session-based logic.
- Typical holding time is tens of minutes to days.
- You run many parameter sweeps, walk-forward tests or machine learning experiments, where run time multiplies.
- You deploy on MT4 or MT5, where history is natively bar-based.
- You want to compare years of history across several asset classes without managing terabytes.
Minute data also scales across history. Twenty thousand bars is only about ten weeks of one-minute intraday history, which is why history length is a real design decision. Minute files let you cover many years and market regimes in a size you can actually open.
Slippage is the usual objection. You can model it explicitly rather than hoping ticks fix it: see our one-line fill formula for simulating minute bar slippage.
Time bars versus tick bars
There is a third option that confuses the debate: bars built from ticks but sampled by activity instead of the clock. Tick bars close after a set number of trades; volume bars after a set number of units traded; dollar bars after a set value. The reasoning is that information arrives with activity, not with the clock.
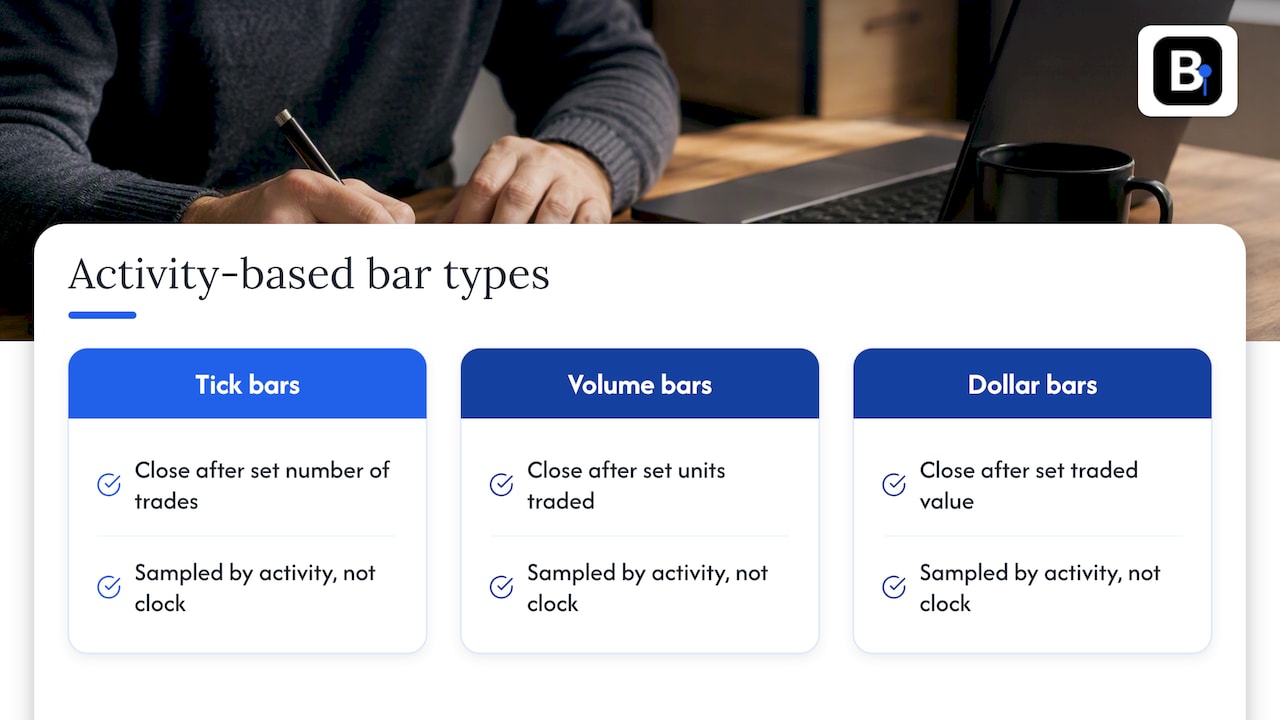
The academic comparison above reports that tick-based Renko and volatility bars reduced serial dependence and random-walk deviations more effectively than minute-based baselines in cryptocurrency markets. That is one market and one study, so treat it as a reason to experiment, not a verdict for forex or indices. Event-based bars need tick data to construct, which is where ticks earn their keep even for strategies that do not trade inside a minute. For a practical walkthrough, see our guide to six bar aggregation methods you can calibrate for ML backtests.
If you want to understand where these formats sit among the broader families of market data, a guide to types of structured market data gives useful context.
How to build minute bars from ticks without corrupting them
Building bars looks trivial: group by minute, take first, max, min, last and sum. Most errors come from the edges. Work through these steps in order.
- Fix the time standard first. Decide on UTC or an exchange time zone and convert everything once. Mixed time zones are a classic source of shifted bars.
- Clean and format timestamps. Documentation on level 2 factor development warns that nonstandard timestamps can cause aggregation errors, and that records must fall into the correct window. Check for out-of-order rows, duplicates and events stamped exactly on a minute boundary.
- Define the window convention. Is the 10:05 bar the interval from 10:05:00 up to but not including 10:06:00, or the one that ends at 10:05? Pick one, document it, and use it everywhere. Mismatched conventions between your data and your platform create a one-bar lookahead.
- Filter to trading sessions. The same documentation recommends filtering to trading sessions. For forex, that means removing weekend prints; our guide to removing weekend bars from forex data covers three methods.
- Choose which price to bar. Trades, bid, ask or mid. For forex, bid-based bars are common, and a spread series alongside helps. Never mix them silently.
- Aggregate OHLCV. Open is the first tick in the window, close the last, high and low the extremes, volume the sum of sizes (or the tick count where no size exists).
- Decide how to treat empty minutes. Either skip them or forward-fill with the prior close and zero volume. Both are valid; inconsistent handling is not.
- Validate. Check that high is at least the maximum of open and close, low is at most their minimum, and no bar has a timestamp outside its session. Compare a few bars against a second source.
Data quality decides the result more than granularity
Traders often assume that more resolution means more accuracy. A tick set with spikes, gaps and duplicates produces a worse backtest than a verified minute set. The failure modes are well known:
- Bad prints and spikes that create phantom highs and lows and trigger stops that never would have hit.
- Gaps and missing minutes that make indicators compute over the wrong lookback.
- Timestamp drift that shifts signals by a bar.
- Weekend or holiday bars that distort volatility and moving averages.
- Undocumented adjustments on futures roll data, which change the price series without telling you.
Detection is cheap. Plot the distribution of bar ranges and inspect the extremes. Count bars per day and compare against expected session length. Compare closes across two sources. These checks cost an hour and can save months of trading on a false edge. Our guide on forex timeframes and cleaner backtest data goes deeper on the minute-chart case.
Our perspective
We collect and verify minute data, so we see this choice from a specific angle. Most traders who ask us about ticks do not need them yet. They need data that is correct.
Our view is simple. First, get the bars right: verified bar by bar, with every adjustment documented, in a format that imports straight into MT4 or MT5. Only then ask whether your strategy's edge is smaller than a minute. If it is, buy ticks and accept the cost. If it is not, spend your effort on slippage modeling, out-of-sample tests and risk, where minute data already gives you plenty of room to work.
The same standard matters if you hand your data to a machine learning pipeline. A model will exploit any artifact it finds, including a stray spike or a timestamp shift, and it will never tell you it did. Clean minute bars with documented handling give both a human and an algorithm a fair test.
— Start
Where our minute data fits
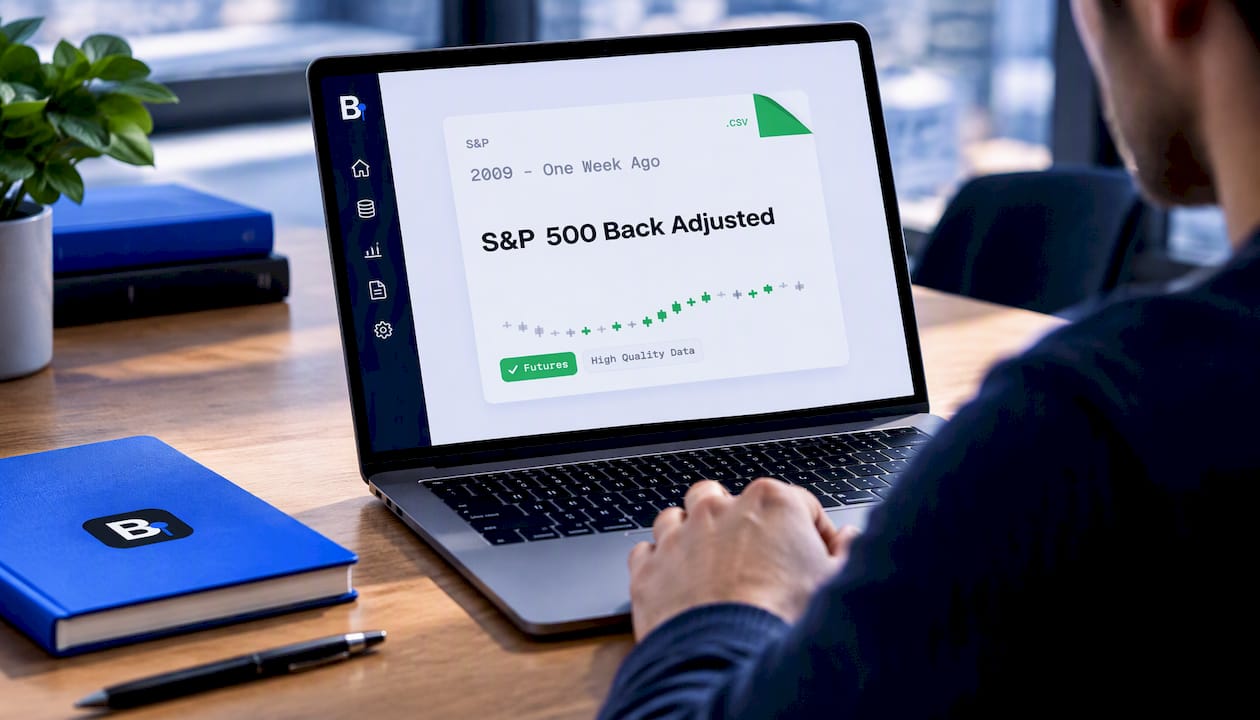
BacktestMarket sells clean minute-bar historical intraday data going back to 2014, covering forex, metals, stock indices, bonds and commodities, as a one-time download ready to import into MT4 and MT5. Bundles by asset class and back-adjusted futures sets are available, and engineers answer support questions directly. Browse the historical data sets, or see the S&P 500 back-adjusted 1 month set as a starting point for index work. The Annual Plan is €119 per year.
If you are still deciding how much data you need to buy, our breakdown of historical market data price bands lays out when buying once makes sense.
A practical decision rule
Run this short test before choosing:
- Write down your average expected profit per trade in pips or points.
- Write down your realistic cost per trade: spread plus slippage.
- If profit is more than about ten times cost and holding time exceeds several minutes, start with minute bars.
- If profit is within a few multiples of cost, or your logic depends on order flow, you need ticks.
- If you are unsure, backtest on minute bars with a conservative slippage rule, then re-test the survivors on ticks. This keeps your sweeps fast and spends the heavy format only on finalists.
The ten-times threshold is a rule of thumb from our own practice, not a published standard. Adjust it to your market and execution.
FAQ
Is tick data more accurate than minute data?
It is more detailed, not automatically more accurate. Tick data keeps every event, but it also keeps every error, so it needs heavier cleaning. A verified minute set can give a more reliable backtest than a noisy tick set.
Can I build minute bars from tick data myself?
Yes. Group ticks by clock window and take the first, highest, lowest and last price plus summed volume. The risks are timestamp errors, time zones, session boundaries and inconsistent handling of empty minutes, so validate the output against a second source.
Can I turn minute data back into tick data?
No. Aggregation discards the order of events inside each minute. Simulated ticks generated from bars are an assumption about that path, not a record of it.
Which one do I need for MT4 or MT5 backtests?
Minute bars are the native history format on both platforms, so clean one-minute OHLCV data imports directly. Tick-level testing needs a separate data pipeline and much more storage.
Are minute bars good enough for scalping?
It depends on your target. If your profit per trade is close to the spread, minute bars hide too much, and ticks are the safer test. For longer intraday holds, minute bars with a conservative slippage model usually suffice.
Sources
- A Frequency-Controlled Comparison of Tick- and Minute-Based Bars
- OHLCV, Tick, and Level 2 Data, NeutralBlock Academy
- Best Practices for Level 2 Quantitative Factor Development, DolphinDB
- Types of Structured Market Data: A BI Professional's Guide
Recommended
- Four Forex Minute Data Sources for Quants Ready for MT4/MT5
- Forex Timeframes: Why Minute Charts Need Cleaner Backtest Data
- Stop False Backtests: 3 QA Checks for MT4/MT5 Import Ready Datasets
- Quants: 3 Places to Download Verified OHLCV Minute Data
Related resources
Explore BacktestMarket's historical data packs to put the ideas in this article into practice.