

Volatility regime detection means labeling each stretch of a price history as a calm, normal or turbulent state, using only the information available at the time, so a strategy can change its size, its filters or its parameters when the state changes. The labels come from a model, such as a Hidden Markov Model, a GARCH-based classifier, a clustering method or a change-point test, run on returns, ranges or implied volatility. This guide covers what feeds those models, how they differ, how to fit them without look-ahead bias, and where they fail in a backtest.
TL;DR
- A volatility regime is a persistent state of the market, such as low or high volatility. Detection is useful because it lets you scale exposure and risk instead of assuming the market never changes.
- Start simple: realized volatility from clean intraday bars, plus an implied-volatility gauge such as the VIX. Add model complexity only if it beats a plain threshold out of sample.
- Fit on a rolling, time-ordered window and use only past data for every label. A regime label that peeks ahead makes any backtest look better than it will trade.
- The usual failure modes are lag, too many regimes and noisy, short-lived switches. Fewer states and a minimum dwell time are the standard remedies.
- Data quality sets the ceiling: one bad tick can fake a volatility spike and a false regime.
Table of Contents
- What a volatility regime is
- Inputs: what to feed a detector
- Methods compared
- Fitting a detector without look-ahead bias
- Where regime detection fails
- Using regimes in strategy design and backtests
- Our perspective
- Getting the data for your regime tests
- FAQ
- Sources
What a volatility regime is
A volatility regime is a characteristic behavior of a return series: for a while, price moves are small and orderly, then they become large and clustered, then they calm again. One academic study of volatility regimes describes them in exactly this way, as a characteristic behavior of a financial time series, and shows that detecting them can support real-time risk decisions such as moving capital away from an asset during volatile periods.
Two properties make the idea workable. First, volatility clusters: a large move tends to be followed by another large move, so today's state tells you something about tomorrow's. Second, the state is not directly observable. You never see a label that says "high volatility"; you infer it from prices, and the inference can be wrong.
That is why the practical question is rarely "what is the true regime?" It is "which simple rule or model lets me change my behavior at a sensible time, without trading on noise?" A quant-methodology guide makes a related point: treating markets as stationary is one of the most expensive mistakes in quant investing, because a factor or a setup that worked in one state can fail in another.
What changes between regimes
When volatility shifts, several things you may have modeled as constants shift with it:
- Stop and target distances. A 20-pip stop is generous in a quiet session and noise in a turbulent one.
- Position size. Constant-size positions mean constant-dollar risk only if volatility is constant.
- Costs. Spreads and slippage widen when markets move fast, which we cover in our piece on transaction costs across three regimes.
- Correlations. Assets that diversify each other in calm markets often move together in stress.
- Strategy fit. Trend-following and mean-reversion rules often favor different states.
Inputs: what to feed a detector
The model matters less than what you give it. There are three families of inputs.
Realized volatility from price bars
The most direct input is volatility measured from your own price history: the standard deviation of returns over a window, the average true range, or realized variance summed from intraday returns. Minute bars give you far more observations per day than daily closes, so a day's volatility can be estimated from intraday data rather than a single close-to-close number. The tradeoff is that minute data is only as good as its cleaning. A single erroneous print can look like an extreme move, so a spike filter such as the three-condition spike test belongs before any regime model.
Implied volatility gauges
Implied volatility looks forward rather than back. The best-known examples are the VIX, which measures the implied volatility of S&P 500 index options, and the VSTOXX, which does the same for near-term EuroStoxx 50 options; both are described as common observable measures for monitoring volatility in an ESMA analysis. Research on equities has also found that forward-looking information from option prices can improve regime detection when combined with return-based inputs, in the covariance-based framing of that line of work. If you test on index data, you can pair your bars with the VIX historical data to use implied volatility as a state variable next to realized volatility.
Cross-asset and covariance inputs
Regimes are not only about one instrument. Research on realized covariance matrices finds they embed information about market regimes, since time-varying covariances react to unexpected news and can serve as inputs to regime-switching models. In practice that means adding a second or third series, such as a currency pair, gold or a bond-yield proxy, when your strategy trades across assets. Our note on engineered intraday correlation shows why correlation windows need care at the session level.
Some researchers go further and add explanatory series such as fund cash flows, monetary interventions or sentiment, noting that multivariate modeling could help detect lasting regime changes. For most system traders, that is a second step after the volatility-only version works.
Methods compared
No single method wins everywhere. The table shows what each family does, what it outputs and where it tends to hurt.
| Method | What it outputs | Strength | Typical weakness |
|---|---|---|---|
| Volatility threshold or percentile rank | Hard label: low, normal, high | Transparent, no fitting, easy to audit | Thresholds are arbitrary and drift with the sample |
| GARCH-family model | Conditional volatility estimate, often thresholded into states | Captures clustering directly | Parameters can be unstable, and the labels are indirect |
| Hidden Markov Model (HMM) | Probability of each hidden state per bar | Models persistence; soft probabilities | Number of states must be chosen; fitting can land on poor solutions |
| Threshold or smooth-transition HAR | Volatility forecast that changes by state | Strong forecasting results in published tests | Needs a sensible switching variable |
| Clustering (for example Wasserstein with spectral clustering) | Groups of similar return segments | No assumed number of regimes | Offline by nature; needs care to use in real time |
| Change-point or structural-break tests | Dates where the process changes | Flags breaks without a state model | Noisy when breaks are frequent |
Rules and thresholds
The baseline is a rule: compute realized volatility over a rolling window, rank it against its own trailing history, and call the top third "high." It is crude, but it is the benchmark every fancier model should beat. If a Hidden Markov Model cannot out-perform a trailing percentile rank after costs, you have added complexity for nothing.
Regime-switching and econometric models
Regime-switching econometric models hold up well against machine learning in published comparisons. A 2025 Federal Reserve paper found that threshold HAR and smooth-transition HAR models consistently outperformed various machine-learning methods when forecasting realized volatility for the S&P 500. The lesson is not that machine learning is useless. It is that a well-specified, low-parameter model is a strong opponent.
Unsupervised learning
Clustering takes a different route. One study uses the Wasserstein metric to measure the distance between the empirical distributions of time-series segments, then groups them with spectral clustering. Because this avoids an a priori assumption about the number of regimes, it can identify volatility structures across assets including large-cap equities and currency pairs. The caution is operational: clustering whole histories is easy; producing a label that is valid at the moment of each bar is the hard part.
Change-point detection
Change-point methods look for the dates when a series' behavior shifts. In a comparison of break-detection techniques, the non-parametric change-point method was more robust than ICSS, being less sensitive to heavy tails and ignoring some spurious break signals. The same work notes that these methods generally perform better when breaks are rare.
Fitting a detector without look-ahead bias
This is where most home-built regime tests go wrong. If you fit a model on the full history and then label every bar, each label was produced by a model that has already seen the future. The backtest then shows a strategy that "avoided" the crash, because the model knew about the crash.
A cleaner protocol:
- Split by time, never at random. Use temporally ordered training and testing windows. The Federal Reserve study mentioned above uses yearly rolling windows, training initially on 1996 to 2005 and then testing across conditions that include the global financial crisis and COVID-19.
- Refit on a schedule. Refit monthly, quarterly or yearly using only data up to that date, and apply the fitted model to the next period only.
- Use filtered, not smoothed, probabilities. For an HMM, the filtered probability at time t uses data up to t. The smoothed probability uses the whole sample and is not tradable.
- Lag your signals by one bar. A label computed from a bar's close cannot change the order placed within that bar.
- Keep one untouched test period. Choose the number of regimes, windows and thresholds on one segment, then judge the result on a segment you have not looked at. Our guide to out-of-sample testing walks through the mechanics.
A worked example: you want a two-state volatility filter on an equity index. Use the first five years to choose a 20-day realized-volatility window and a percentile cutoff. Freeze them. Then step forward one quarter at a time, recomputing the percentile rank on a trailing window only, and record the strategy's trades with and without the filter. If the filter helps in the frozen test years as well as in the choosing years, you have something. If it helps only in the years you tuned on, you have a curve fit.
Where regime detection fails
Treat these as design constraints, not footnotes.
Lag. Detectors need evidence, and evidence takes time. By the time a model is confident that volatility has risen, much of the move may be over. A quant-methodology guide lists regime-prediction lag among the common pitfalls. Plan for the cost of being late rather than hoping to be early.
Too many regimes. Each added state adds parameters and splits your sample thinner. The same source warns that too many regimes can make a model impossible to trade. Two or three states are usually enough for sizing decisions.
Noisy switching. If the label flips every few bars, your strategy churns and pays costs on each flip. Break-detection research notes that short-lasting signals may be noisy byproducts of heavy-tailed returns. Add a minimum dwell time, such as requiring a new state to persist for several bars or days before acting, or use a hysteresis band with different entry and exit thresholds.
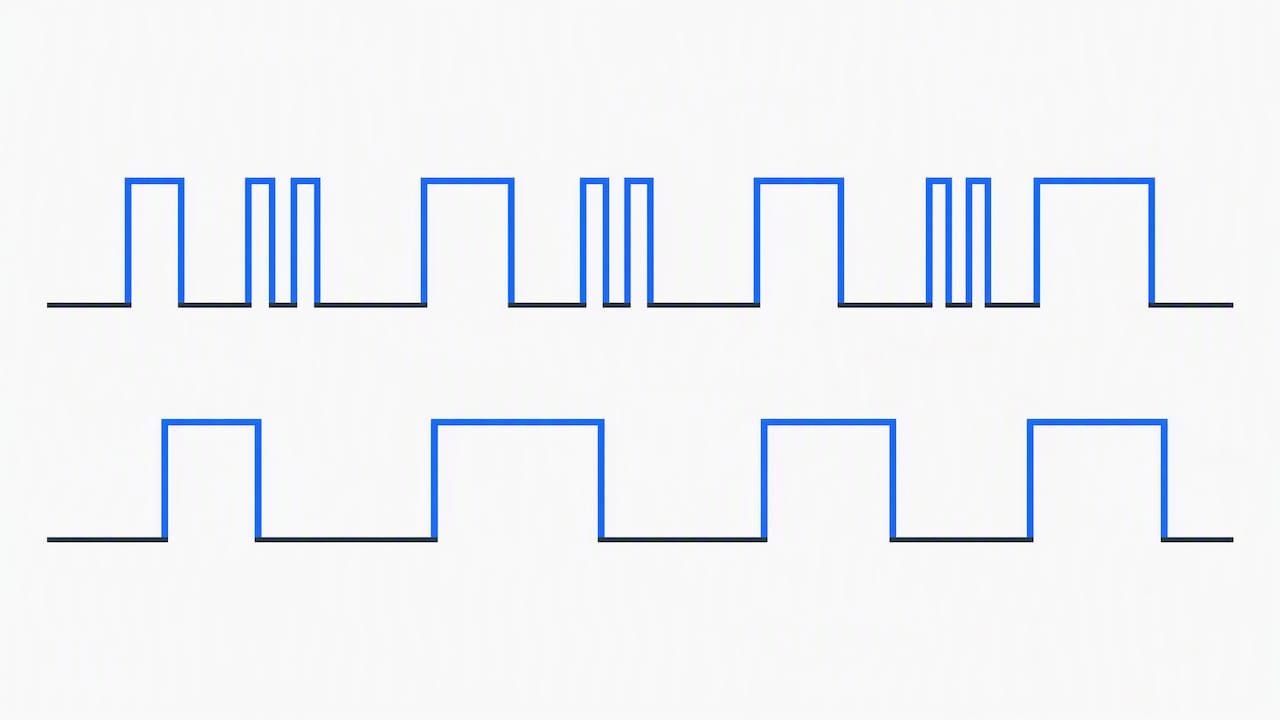
Variation inside a regime. A "high volatility" label covers very different days. The same guide cautions that conditions still vary within a detected regime, so do not treat a label as a guarantee.
Bad data posing as a regime. A bad tick, a missing session or an unadjusted roll can create a spike that a model reads as a state change. Clean bar-by-bar data and documented adjustments matter more for a regime model than for a simple moving-average rule, because the model's whole input is variance.
Unstable labels across refits. An HMM refit next quarter may swap which state is called 1 and which is 2. Always sort states by their volatility level after fitting so "state 0" always means the calmest.
Using regimes in strategy design and backtests
Once you have a label, there are four common uses.
- Exposure scaling. Cut position size when the state is high-volatility, or target constant volatility.
- Strategy switching. Run a trend rule in one state and a mean-reversion rule in another, or turn a system off in a state where it historically loses.
- Parameter adaptation. Widen stops, targets or lookbacks with the state.
- Asset rotation. Move between assets by regime.
Published evidence gives a sense of the potential, with a caveat that it comes from specific samples. In one study, a simple rule held SPY in low-volatility periods and moved to GLD in high-volatility periods, reporting superior risk-adjusted returns to the S&P 500 index across various market conditions. On the forecasting side, a 2026 study on ten years of S&P 500 data found a regime-adaptive deep ensemble improved RMSE by 55.6% versus a HAR-RV baseline, and cross-asset checks across five asset classes (S&P 500, NASDAQ-100, Russell 2000, EUR/USD and gold) reported R-squared values from 0.888 to 0.920. Forecast accuracy is not trading profit, though: a better volatility forecast still has to survive spreads, slippage and your own sizing rules.
When you backtest a regime filter, report results by regime as well as in total. Show trades, win rate, average return and drawdown separately for each state. If the whole improvement comes from one rare period such as a single crisis, say so. Intraday systems should also check whether the regime effect is really a time-of-day effect; our guide to intraday seasonality shows how to separate the two, and the day trading strategies overview is a useful map of the setups a filter can be attached to.
Our perspective
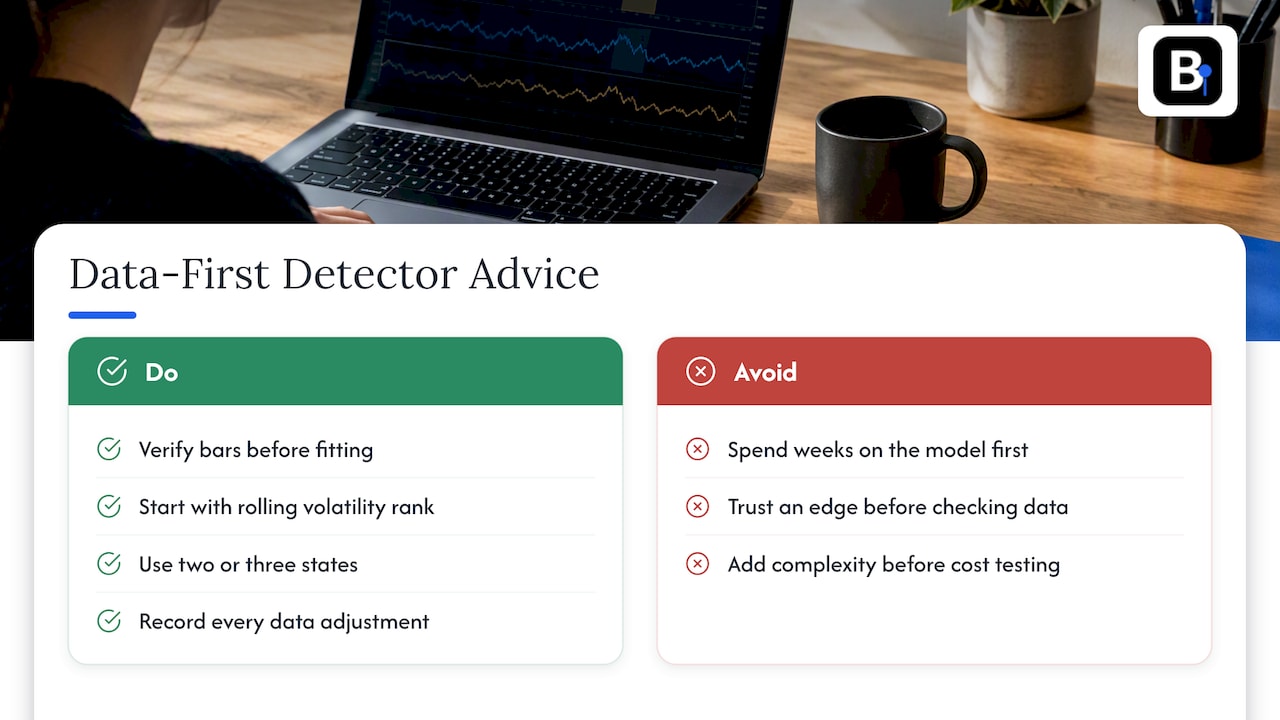
We collect and maintain minute-bar data, so we see the same failure again and again: people spend weeks on the model and minutes on the input. A regime detector is a variance estimator with a decision rule on top, and variance is exactly what bad data corrupts. One duplicated bar, one missing hour, one unadjusted futures roll, and a calm week looks like a storm.
Our advice is plain. Build the dull version first: a rolling realized-volatility rank on verified bars, two or three states, a dwell time, and a strict walk-forward test. Only then ask whether a Hidden Markov Model or a clustering method adds anything net of costs. Keep a record of every adjustment applied to your data, so that when a regime result looks too good, you can rule out the data before you believe the edge. That standard applies equally to a human running MT5 and to an AI pipeline that will happily learn from whatever it is fed.
— Start
Getting the data for your regime tests
Regime work needs long, consistent minute histories across several assets, loaded into the platform where you test. Our historical data is clean minute-bar intraday data since 2014 across forex, metals, bonds, stock indices and commodities, delivered as complete data sets ready to import into MT4 and MT5. For index-based regime work, start with the stock indices data. The Annual Plan is €119 per year.
If you want the same volatility measure we use as a quick regime proxy, our Average Range Indicator is a place to start.
FAQ
How many volatility regimes should I use?
Two or three. More states mean more parameters and thinner samples, and a guide on regime detection warns that too many regimes can make a model impossible to trade. Start with low and high, add a middle state only if it changes a decision you actually make, such as position size.
Is a Hidden Markov Model better than GARCH for regime detection?
They answer slightly different questions. A GARCH-type model estimates conditional volatility, which you then threshold, while an HMM infers a hidden state and gives you probabilities. Published forecasting comparisons have favored well-specified regime-switching econometric models over many machine-learning methods, so test both against a plain percentile rule on your own data.
Can I use the VIX alone to define regimes?
Yes, as a starting point for US equity indices. The VIX is a widely used measure of implied volatility from S&P 500 options, and a threshold or percentile rank on it is simple to audit. It does not cover other assets, so for forex or metals you will want realized volatility from those instruments' own bars.
How do I know my regime label does not look ahead?
Check that every label at time t was produced by a model fitted only on data before t, and that the signal is applied from the next bar. If you use an HMM, use filtered rather than smoothed probabilities. A quick test: truncate your data at an earlier date and recompute. If past labels change, they were using future information.
How much history do I need?
Enough to contain several distinct volatility environments, including at least one stressed period, with room to hold out a test segment. Minute bars give many observations per day, but regimes change slowly, so the number of independent regime episodes is what limits your confidence, not the number of bars.
Sources
- Structural clustering of volatility regimes for dynamic trading strategies
- Regime Detection: Finding the Market States Your Factors Live In
- Linear and nonlinear econometric models against machine learning for realized volatility
- Monitoring volatility in financial markets (ESMA)
- Selected techniques of detecting structural breaks in financial volatility
- Market regime detection via realized covariances
- Uncertainty calibrated volatility forecasting through regime-adaptive ensembles
Recommended
- Transaction Costs for Quants: Test 3 Regimes, Watch Engine Risk
- Out-of-Sample Testing: How to Validate a Trading Strategy
- Spread Modeling for Backtests: 3 Estimators to Stress Test ML Edge
Related resources
Explore BacktestMarket's Expert Advisor robots to put the ideas in this article into practice.